This Excel stock portfolio tracker template from PlanoraNest is a personal investment tracking spreadsheet with live Google Sheets price integration, gain/loss calculations, and historical performance charts. Six sheets with GOOGLEFINANCE-powered live quotes and automated CAGR returns. One-time purchase at $3.9 (compare at $6.9), instant download, no subscription.
Who it's for
This stock portfolio tracker is built for individual investors who want to monitor their holdings without a brokerage dashboard:
- Individual investors who hold stocks, ETFs, and index funds across multiple accounts and want a consolidated view.
- DIY portfolio managers who track cost basis, unrealized gains, and realized gains/losses in one spreadsheet.
- Investors who want historical price data and performance charts without paying for a portfolio tracking service.
- Beginners learning how to calculate investment returns (CAGR, unrealized vs. realized gains) with real data.
What's included in this Excel template
Six sheets covering live quotes, portfolio tracking, and historical analysis:
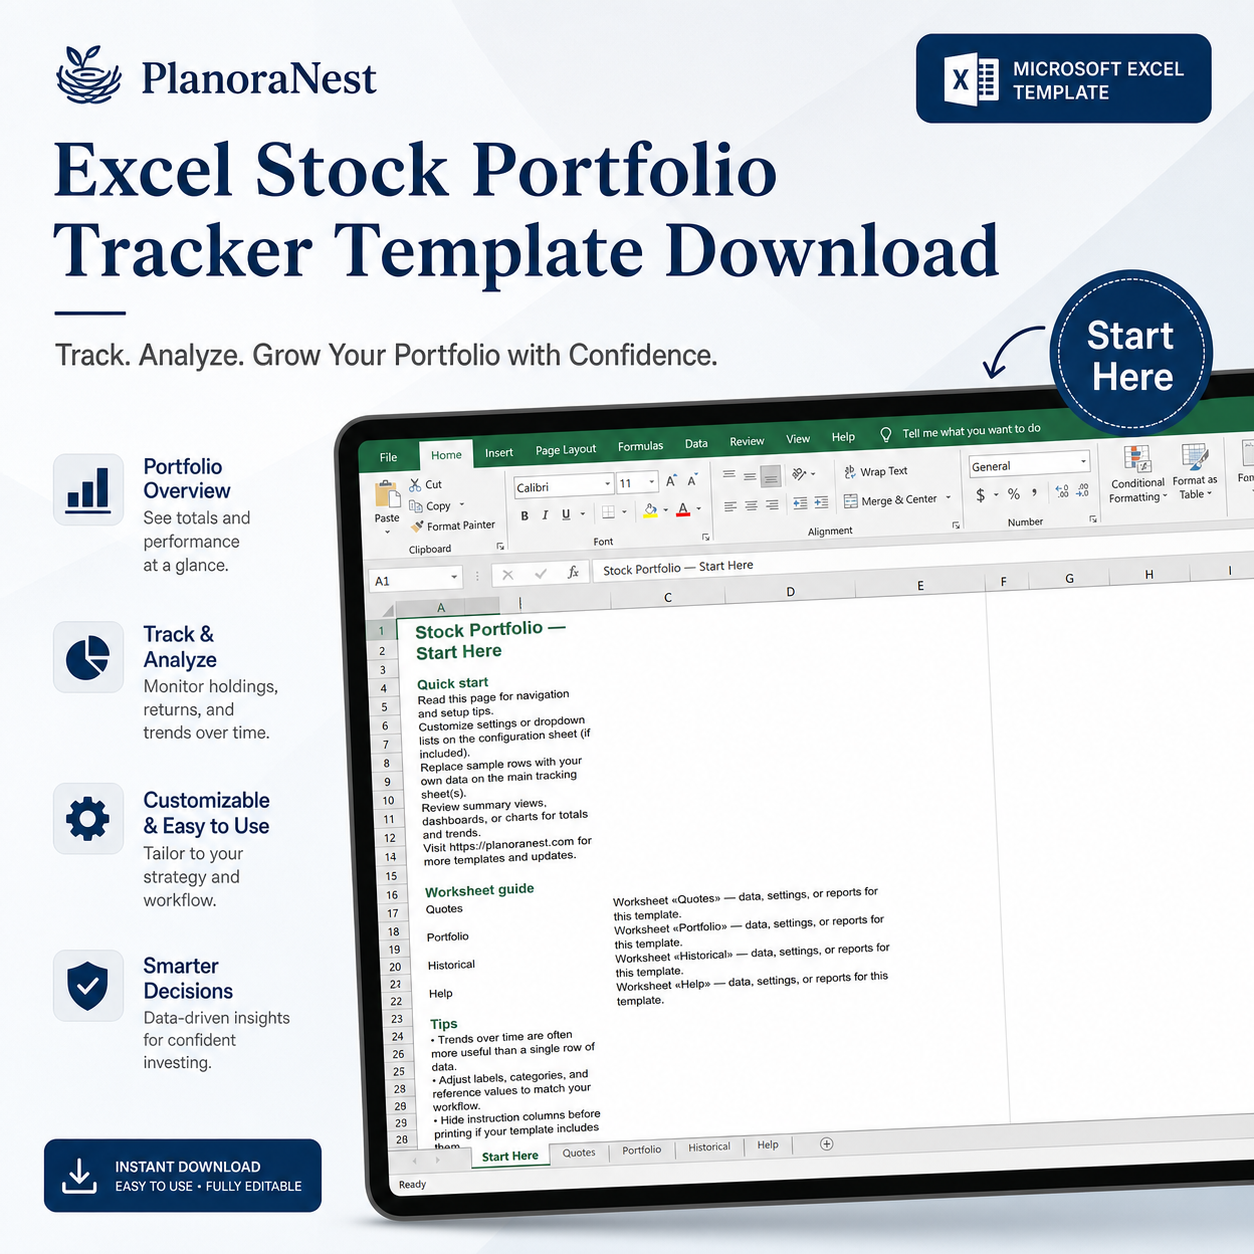
Start Here sheet
Quick-start guide with navigation tips and setup instructions. Includes the PlanoraNest link for more templates and updates.
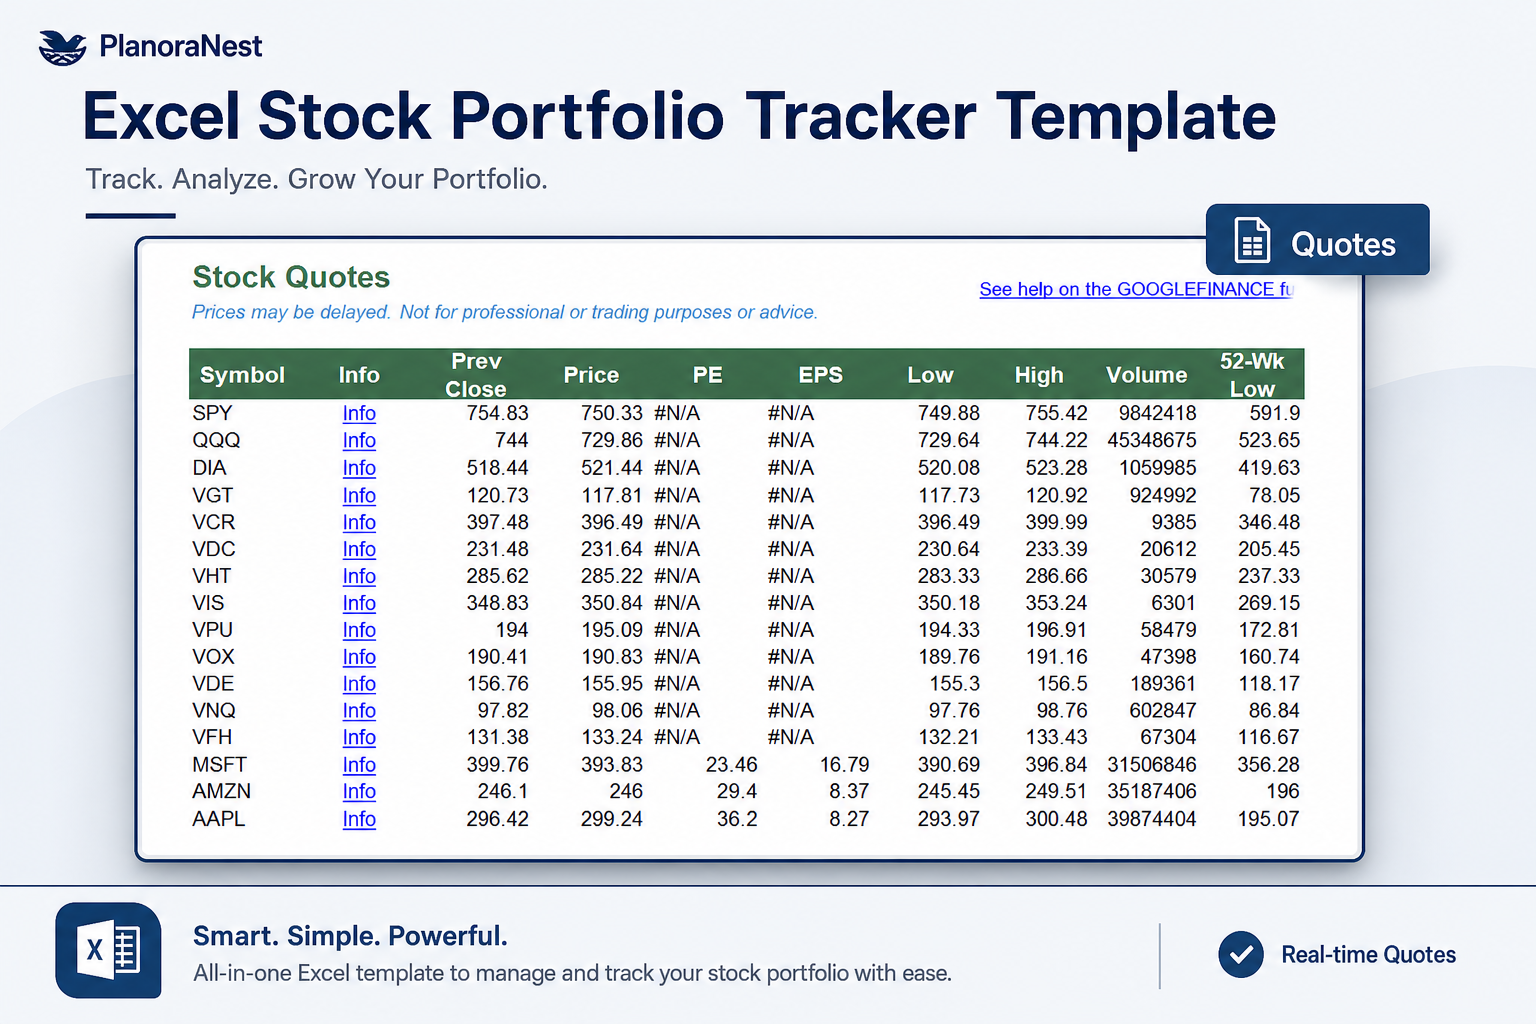
Quotes sheet
Live stock price dashboard with 11 columns per ticker: Symbol, Info, Prev Close, Price, PE, EPS, Low, High, Volume, 52-Wk Low, and 52-Wk High. Each row uses the GOOGLEFINANCE function wrapped in IFERROR to pull live or near-real-time data from Google Finance. The Info column is a clickable hyperlink to the stock's detail page. Add any symbol (stocks, ETFs, mutual funds) to column A and copy the formulas down. Includes sample data for SPY, QQQ, DIA, VGT, and VCR.
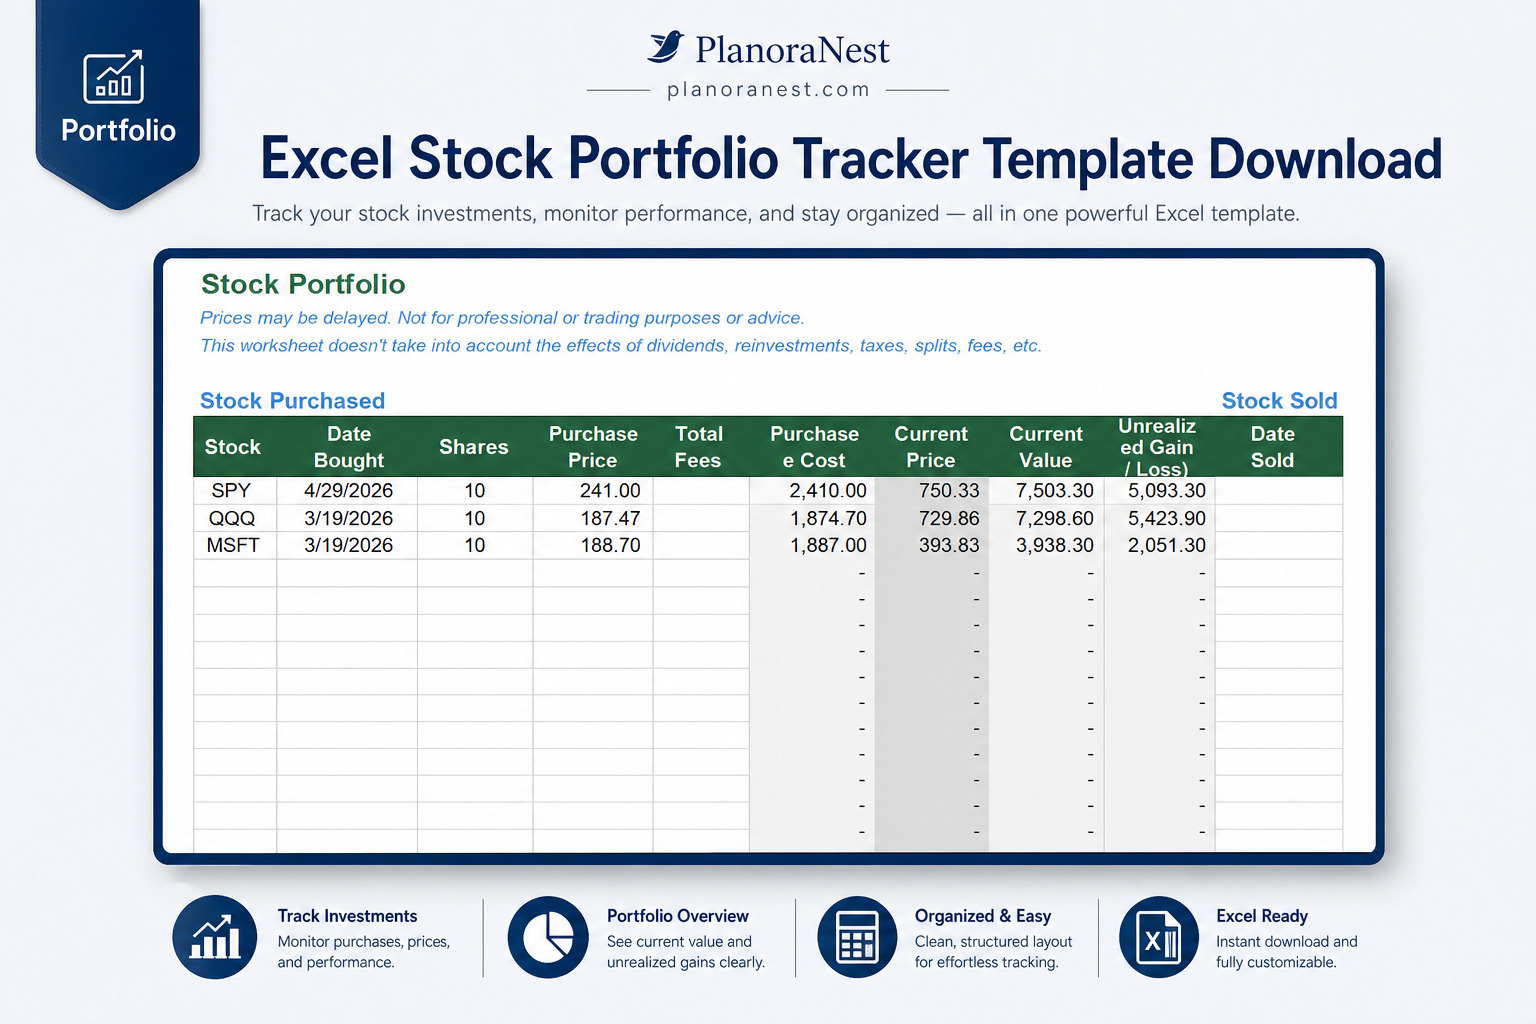
Portfolio sheet
Your holdings tracker with 14 columns split into Purchased and Sold sections. Stock Purchased: Stock, Date Bought, Shares, Purchase Price, Total Fees, Purchase Cost (Shares x Price + Fees), Current Price (GOOGLEFINANCE), Current Value (Current Price x Shares), Unrealized Gain/Loss (Current Value - Purchase Cost). Stock Sold: Date Sold, Sell Price, Income from Sale (Sell Price x Shares), Realized Gain/Loss (Income - Purchase Cost). CAGR (Compound Annual Growth Rate) calculates automatically for each holding using the formula: (Current Value / Purchase Cost)^(365/days held) - 1, using TODAY() for open positions. Tracks buy-and-hold positions as well as fully exited trades.
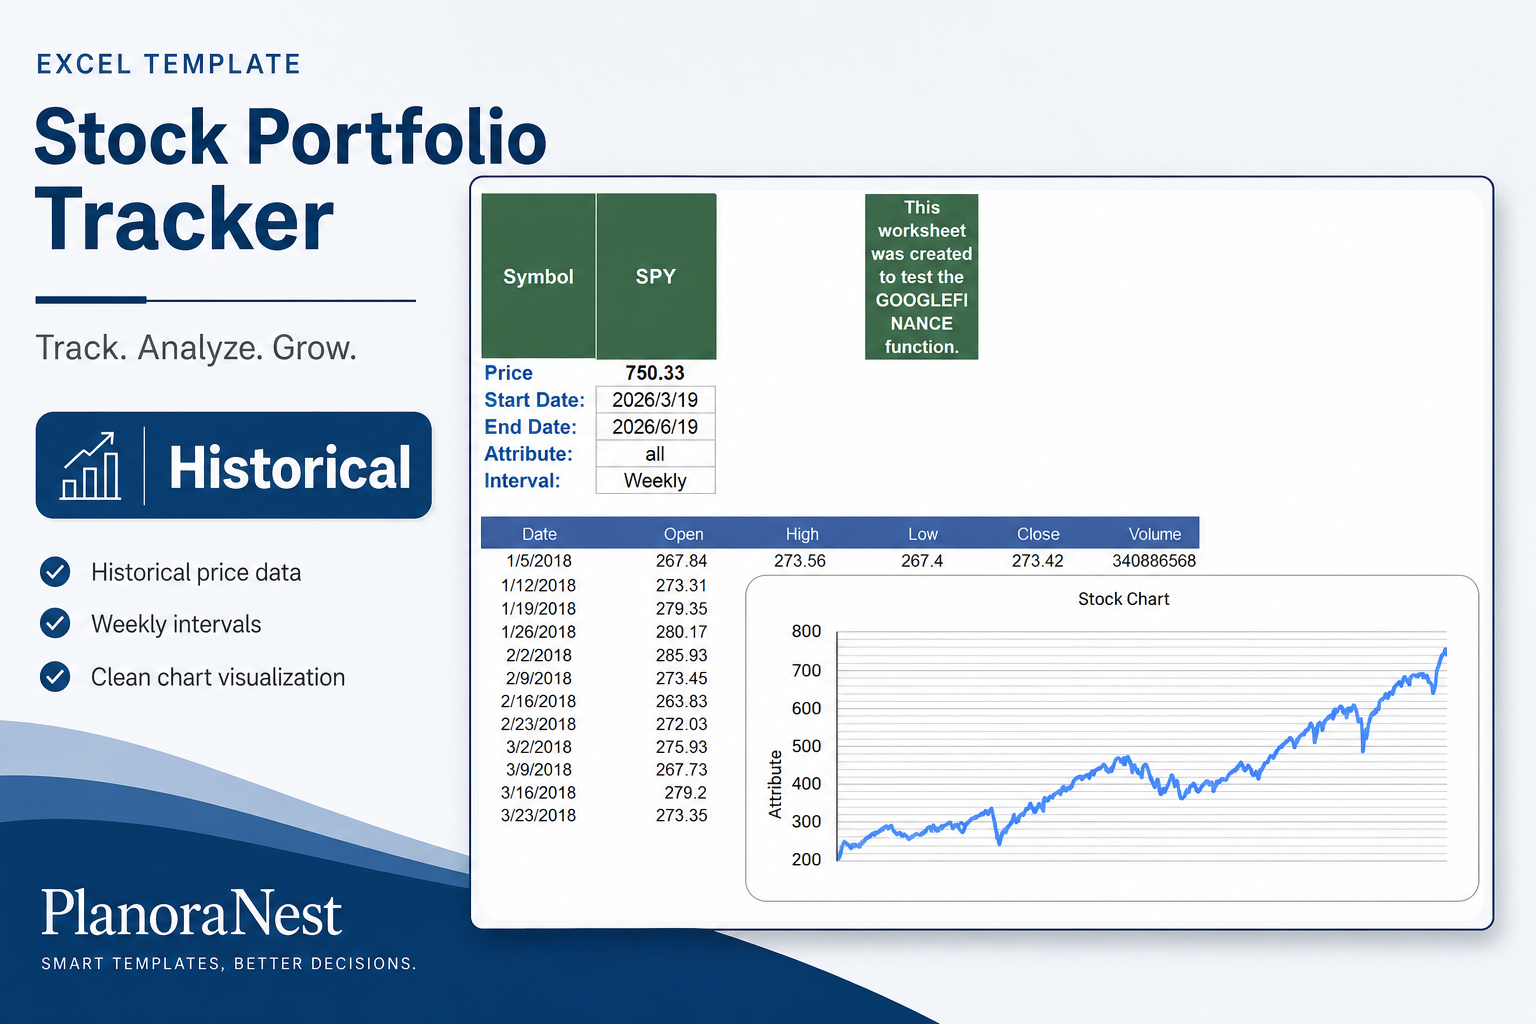
Historical sheet
Historical price data engine with 1,200+ rows. Configure a Symbol, Start Date, End Date, Attribute (price, all), and Interval (Daily, Weekly). The sheet pulls historical open, high, low, close, and volume data via GOOGLEFINANCE. Use this for chart-ready data, performance analysis, and backtesting. Sample data shows SPY weekly prices dating back to 2018.
Help sheet
Documentation covering template overview, how to add more stock quotes (enter symbol in column A, copy formulas), GOOGLEFINANCE function guidance, and links to related financial templates (Simple Investment Tracker, Financial Calculators, Budget Templates).
About sheet
Template credits, license information (personal and commercial use allowed, no resale), and usage notes — designed for personal and business productivity.
| Sheet | What it does |
|---|
| Start Here | Quick-start guide for portfolio tracking setup |
| Quotes | Live price dashboard: Symbol, Price, PE, EPS, High/Low, Volume, 52-Week Range via GOOGLEFINANCE |
| Portfolio | Holdings tracker: Purchase Cost, Current Value, Unrealized/Realized Gain-Loss, CAGR with TODAY() |
| Historical | 1,200+ rows of price history (Date, Open, High, Low, Close, Volume) via GOOGLEFINANCE |
| Help | Documentation and links to related financial templates |
| About | Credits and license terms |
Preview
See how each sheet looks before you download — screenshots from the actual template.
Historical Performance
Preview of Excel Stock Portfolio Tracker Template Download | PlanoraNest Template
Portfolio Holdings
Preview of Excel Stock Portfolio Tracker Template Download | PlanoraNest Template
Stock Quotes
Preview of Excel Stock Portfolio Tracker Template Download | PlanoraNest Template
Start Here
Preview of Excel Stock Portfolio Tracker Template Download | PlanoraNest Template
How to use this Excel template
Get your stock portfolio tracker running with live data in under 15 minutes:
- Open the file in Google Sheets — the GOOGLEFINANCE functions require Google Sheets to pull live prices. (The template also works in Excel with static data if you paste values.)
- Read the Start Here sheet for a quick tour.
- Go to the Quotes sheet and replace the sample symbols (SPY, QQQ, DIA, VGT, VCR) with your own tickers in column A. Copy the formulas from the previous rows to populate Price, PE, EPS, Volume, and 52-week range data.
- Move to the Portfolio sheet and enter your holdings: Stock symbol, Date Bought, Shares, Purchase Price, and any fees. Purchase Cost, Current Price, Current Value, and Unrealized Gain/Loss calculate automatically. For sold positions, enter Date Sold and Sell Price — Realized Gain/Loss and CAGR calculate automatically.
- Use the Historical sheet to pull price history for any symbol. Set the Symbol, Start Date, End Date, and Interval — the sheet populates with Date, Open, High, Low, Close, and Volume data ready for charting.
- Check the Help sheet if you need guidance on adding more stocks or understanding the GOOGLEFINANCE function.
Works with
- Google Sheets (recommended — required for live GOOGLEFINANCE prices)
- Microsoft Excel (desktop & web — works with static or manually-entered prices)
- WPS Office
- LibreOffice Calc
One-time purchase — $3.9 USD (compare at $6.9) — Instant download — No account required to use the file after purchase.