Simple Investment Tracker Excel: Columns That Stay Maintainable

Design a simple investment tracker excel sheet with cost basis, market value, and gain/loss columns you will actually update.
A simple investment tracker excel file fails when it tries to be a Bloomberg terminal. The version you will reopen has a short column list, clear units, and a Summary that still works after you insert a row. For the full hub on SERP landscape, free vs paid paths, and monthly habits, see the excel spreadsheet investment tracking simple guide.
Key takeaway: Prefer ten honest columns you update monthly over forty automated fields you abandon after the first price refresh breaks.
Simple tracker vs portfolio dashboard
A simple tracker answers: what did I invest, what is it worth, and what is the difference? A dashboard answers allocation drift, dividend calendars, and risk metrics. Expense Sorted’s template taxonomy puts “simple trackers” in the under-twenty-holdings bucket for a reason. Kotak Neo’s stock portfolio tracker tutorial lists the classic columns — ticker, purchase price, shares, current price, market value, profit/loss, percent gain/loss. Steal that skeleton; skip the rest until you need it.
[TABLE: Columns that earn their keep]
| Column | Purpose | Typical mistake |
|---|---|---|
| Date | Audit trail | Leaving blank “sometime in March” |
| Ticker / label | Identity | Renaming the same ETF three ways |
| Shares | Quantity | Mixing fractional share rounding silently |
| Avg cost / share | Basis | Averaging without documenting lots |
| Current price | Mark | Forgetting last-updated date |
| Market value | Shares × price | Hard-coding value instead of formula |
| Gain/loss $ | Value − cost | Mixing withdrawn cash into “loss” |
| Gain/loss % | Normalized | Dividing by market value instead of cost |
Build the minimal sheet
Simple tracker setup
- Create a Holdings table with the columns above.
- Add a Contributions log on a second sheet if cash movements matter more than tickers.
- Put Totals above or beside the table: total cost, total market value, total gain/loss.
- Freeze the header row. Protect formula cells if others edit the file.
- Add a “Last refreshed” cell and update it whenever prices change.
- Color only the gain/loss column — one conditional format rule is enough.
Microsoft’s financial management template gallery is adjacent for budgeting; for investment tracking, Tiller’s Excel Stocks walkthrough shows how linked data types can fill current prices. Use live prices only if you will open the file on a schedule.
What “simple” should refuse
Refuse day-trader watchlists, options Greeks, and twelve allocation charts on day one. Sites such as Vertex42 rank for simple investment tracker downloads in research SERPs — mention as plain text only, never as a published hyperlink. Community threads on Reddit often praise Google Sheets with GOOGLEFINANCE; that is fine if Sheets is your home. If your co-parent or accountant lives in desktop Excel, prefer an .xlsx-friendly layout.
When a structured workbook helps
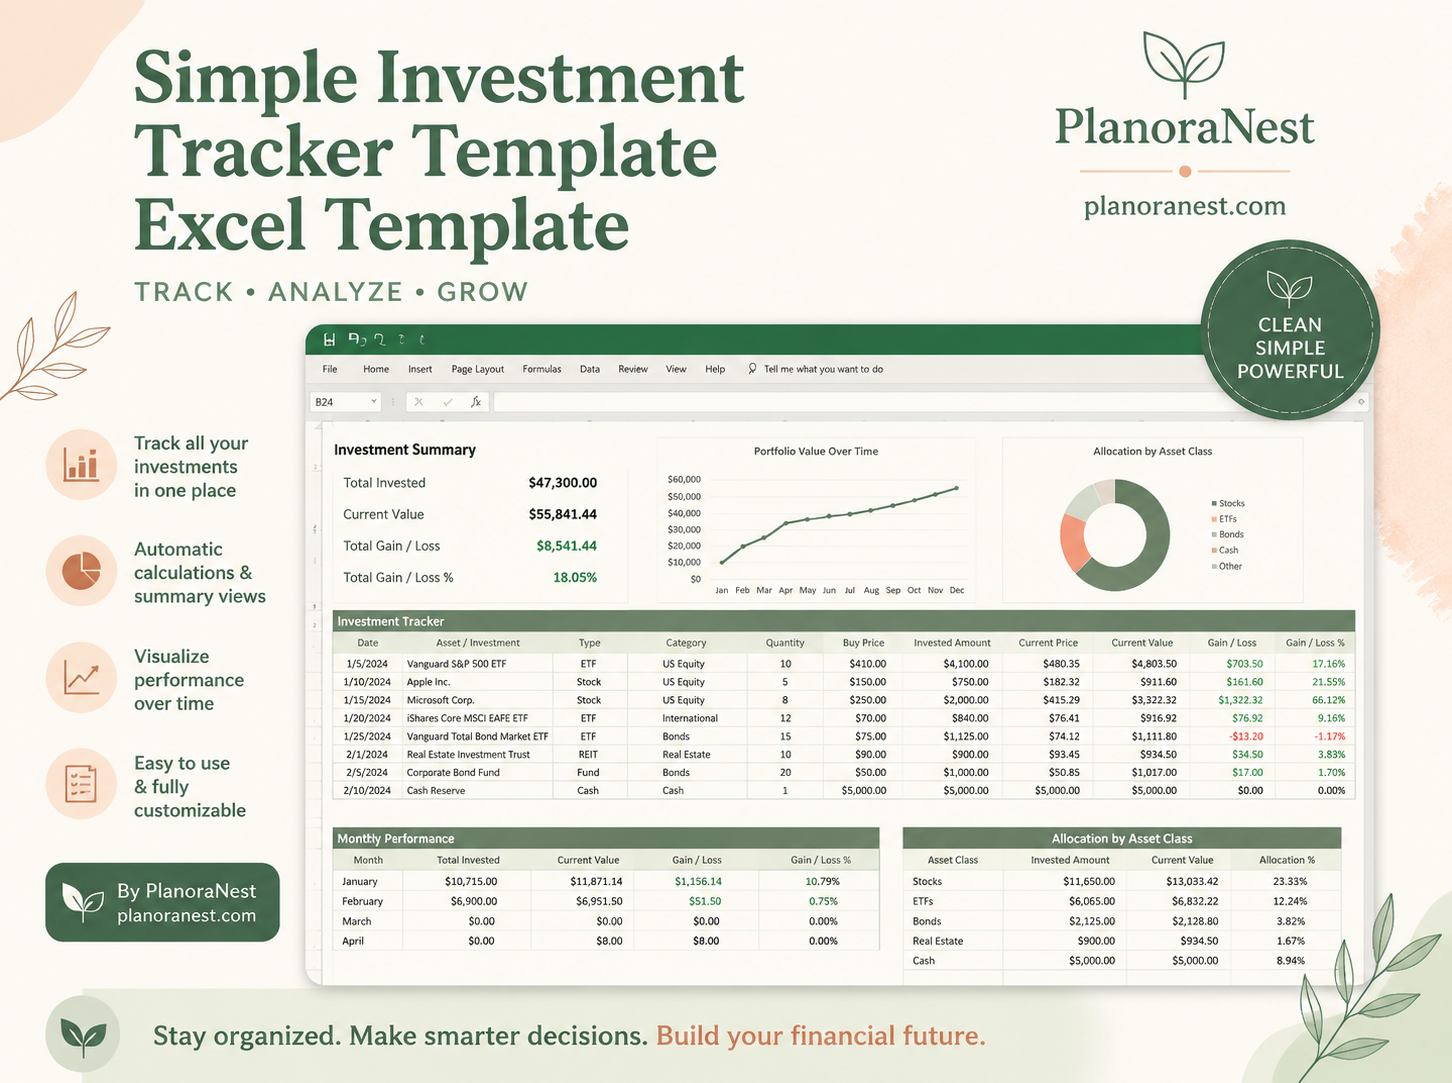
DIY is fine when you enjoy formula maintenance. A structured workbook helps when you want Start Here instructions, an Account1-style log, and a Summary already wired. The PlanoNest investment tracking template is a one-time purchase with instant digital download for Excel, Google Sheets, WPS, and LibreOffice Calc — see the product page for live pricing.
[PRO_CON]
Blank DIY tracker
- Pros: exact columns you invent; no license questions
- Cons: Summary breaks when someone inserts a column; no Help sheet
Structured simple workbook
- Pros: labeled rows; faster onboarding; fewer “what does this cell mean?” chats
- Cons: you still type real numbers; live prices remain optional
Operating rhythm
Weekly: refresh prices or paste statement value. Monthly: reconcile contributions. Quarterly: archive a dated copy before redesigning columns. [STAT_HIGHLIGHT] A simple tracker that is three weeks stale still beats a perfect model you never open.
Checklist
- Can a new user add a holding without reading a novel?
- Are cost and market value clearly separated?
- Is there a last-refreshed stamp?
- Does percent gain/loss use cost in the denominator?
- Can you export or print Summary for a meeting?
FAQ
How many holdings is “simple”? Roughly under twenty liquid tickers or one account total is the sweet spot. Beyond that, add account tabs or an aggregator.
Should I track dividends in the same table? Start with a Notes column or a separate dividend log. Mixing dividends into purchase price without documentation creates fake basis.
Excel or Google Sheets? Whichever your collaborators already open. Feature parity matters less than update discipline.
Operating notes for consistent tracking (1)
Keep categories stable for at least one quarter before renaming. When you change a label, add a migration note on the Help sheet so historical rows remain searchable. Reconcile the tracker to the brokerage cash activity report once a month: unmatched rows usually mean a transfer between accounts was recorded twice or not at all. If you collaborate, give editors rights only to input columns and keep Summary formulas protected. Review gain/loss in dollars and percent together — a large percent on a tiny position can distract from the dollars that actually matter for your plan. Finally, store one archived copy each quarter in a folder named by date so experiments never overwrite the working file.
Operating notes for consistent tracking (2)
Keep categories stable for at least one quarter before renaming. When you change a label, add a migration note on the Help sheet so historical rows remain searchable. Reconcile the tracker to the brokerage cash activity report once a month: unmatched rows usually mean a transfer between accounts was recorded twice or not at all. If you collaborate, give editors rights only to input columns and keep Summary formulas protected. Review gain/loss in dollars and percent together — a large percent on a tiny position can distract from the dollars that actually matter for your plan. Finally, store one archived copy each quarter in a folder named by date so experiments never overwrite the working file.
Operating notes for consistent tracking (3)
Keep categories stable for at least one quarter before renaming. When you change a label, add a migration note on the Help sheet so historical rows remain searchable. Reconcile the tracker to the brokerage cash activity report once a month: unmatched rows usually mean a transfer between accounts was recorded twice or not at all. If you collaborate, give editors rights only to input columns and keep Summary formulas protected. Review gain/loss in dollars and percent together — a large percent on a tiny position can distract from the dollars that actually matter for your plan. Finally, store one archived copy each quarter in a folder named by date so experiments never overwrite the working file.
Operating notes for consistent tracking (4)
Keep categories stable for at least one quarter before renaming. When you change a label, add a migration note on the Help sheet so historical rows remain searchable. Reconcile the tracker to the brokerage cash activity report once a month: unmatched rows usually mean a transfer between accounts was recorded twice or not at all. If you collaborate, give editors rights only to input columns and keep Summary formulas protected. Review gain/loss in dollars and percent together — a large percent on a tiny position can distract from the dollars that actually matter for your plan. Finally, store one archived copy each quarter in a folder named by date so experiments never overwrite the working file.
Operating notes for consistent tracking (5)
Keep categories stable for at least one quarter before renaming. When you change a label, add a migration note on the Help sheet so historical rows remain searchable. Reconcile the tracker to the brokerage cash activity report once a month: unmatched rows usually mean a transfer between accounts was recorded twice or not at all. If you collaborate, give editors rights only to input columns and keep Summary formulas protected. Review gain/loss in dollars and percent together — a large percent on a tiny position can distract from the dollars that actually matter for your plan. Finally, store one archived copy each quarter in a folder named by date so experiments never overwrite the working file.
Disclosure
PlanoNest sells related templates. Product links point to our shop.