 Quick view
Vendor: PlanoNest
Pick Chart Excel Template | Pick Chart Template ExcelRegular price $6.90
Sale price $3.90
4.7 / 5.0 (3) total reviews
Vendor: PlanoNest
Regular price $6.90
Sale price $3.90
Excel
Quick sign in at checkout — your templates are saved to your library forever.
Related picks
Explore other digital products that pair well with this template.
Quick viewVendor: PlanoNest
Pick Chart Excel Template | Pick Chart Template ExcelRegular price $6.90
Sale price $3.90
 Quick view
Vendor: PlanoNest
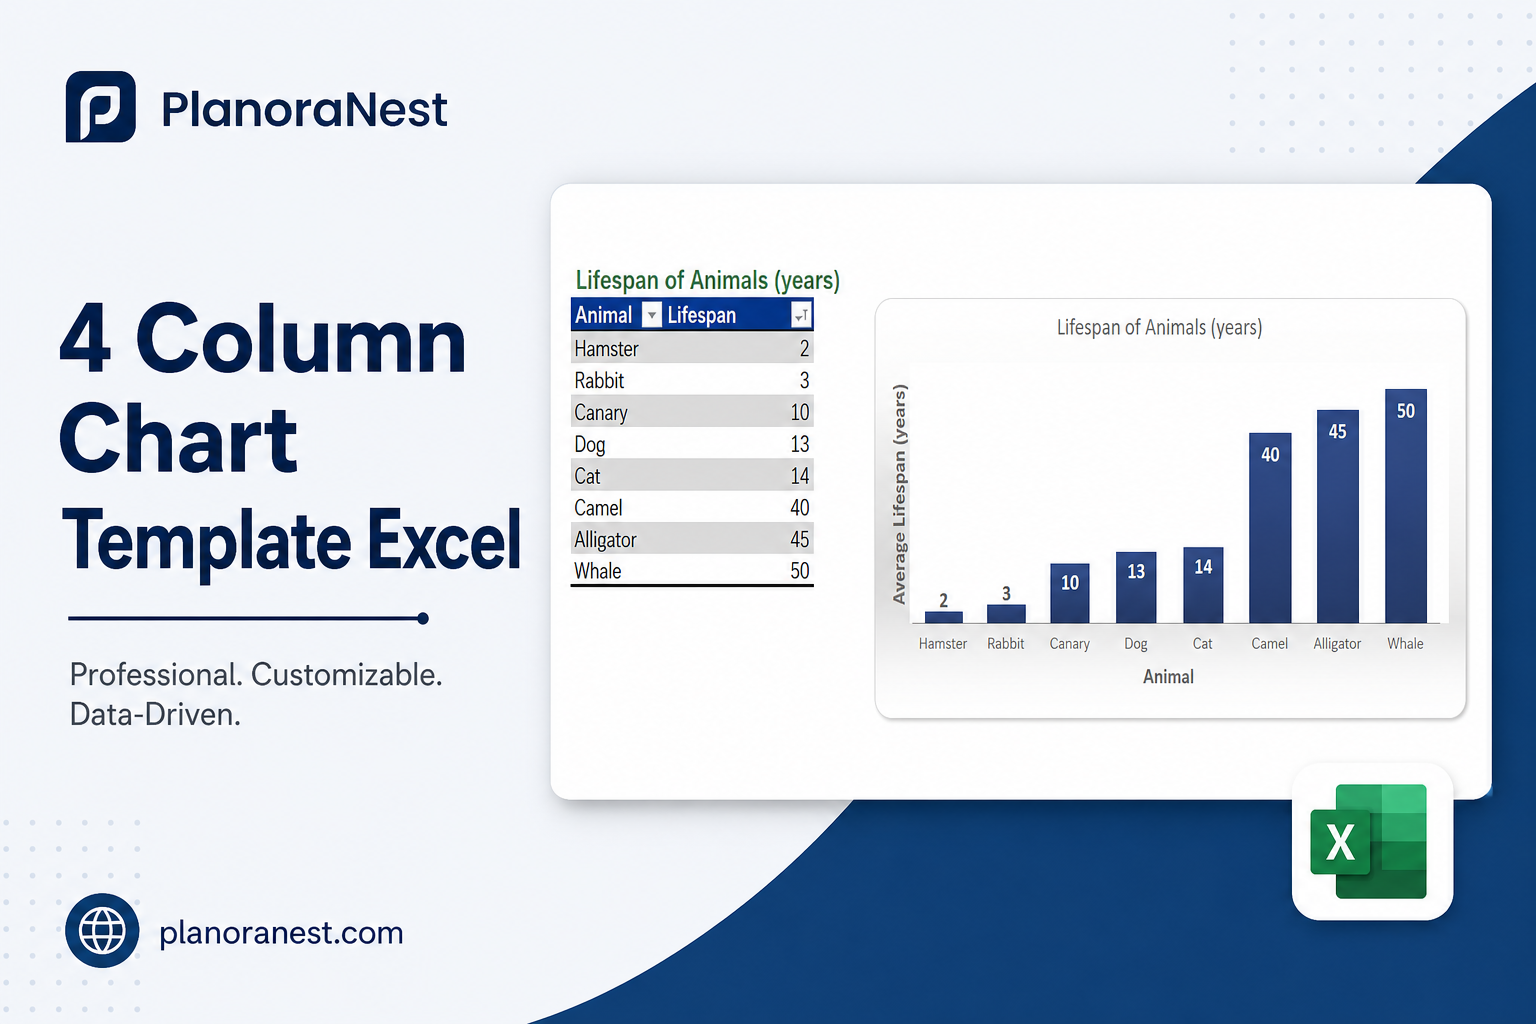
4 Column Chart Template Excel | PlanoraNest TemplateRegular price $6.90
Sale price $3.90
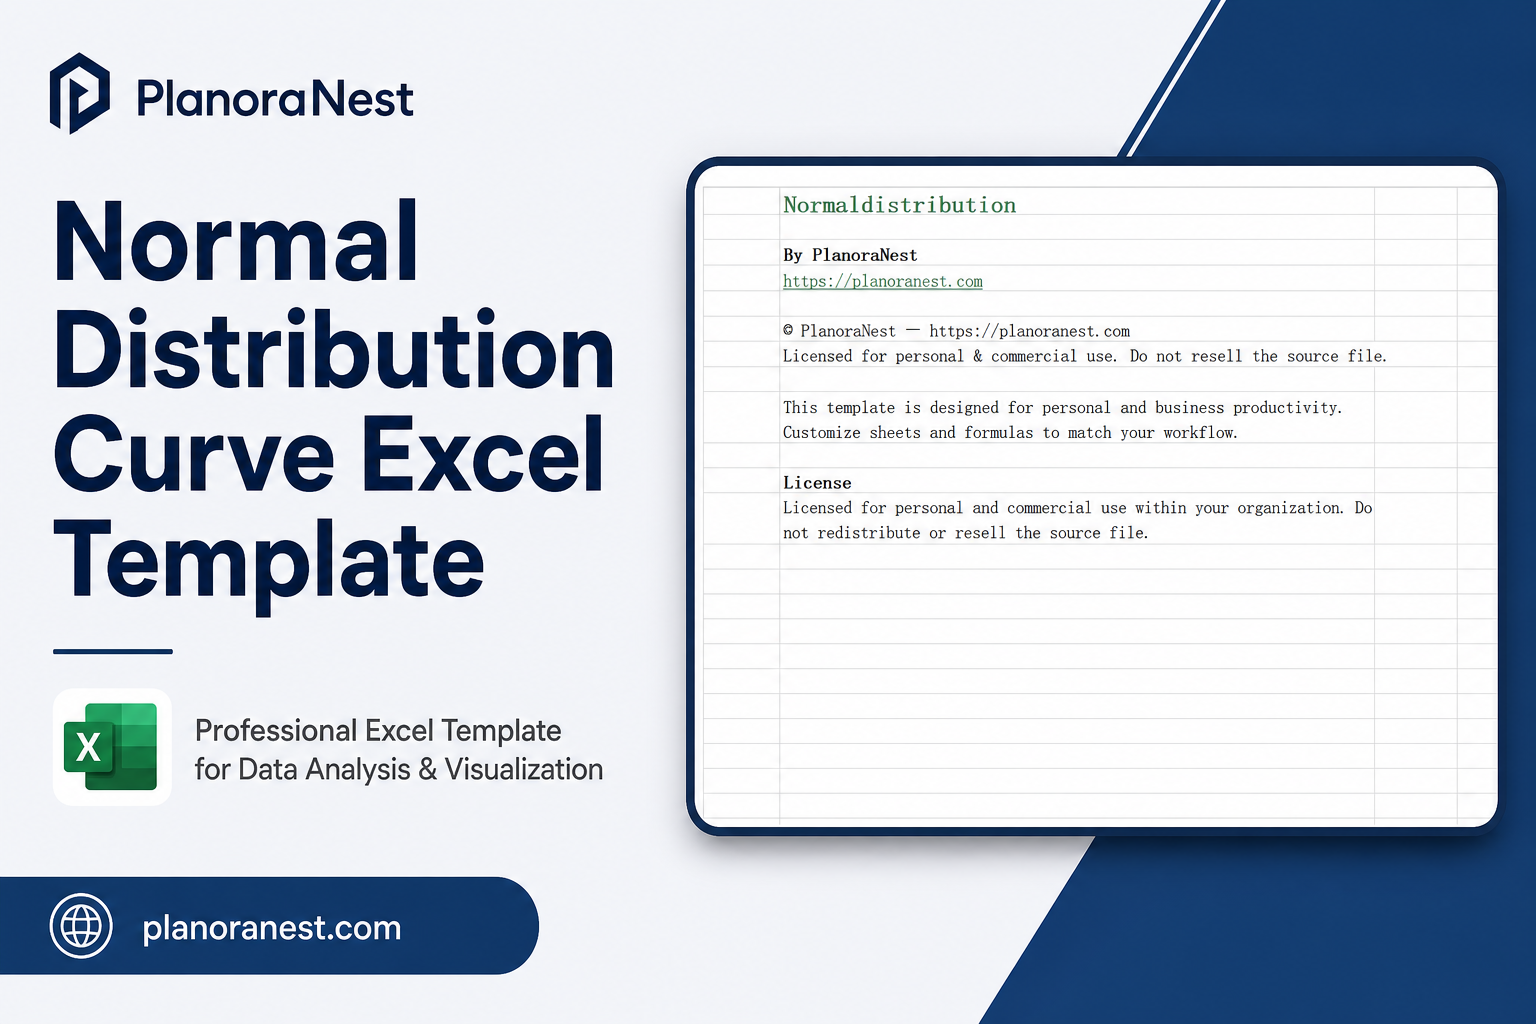
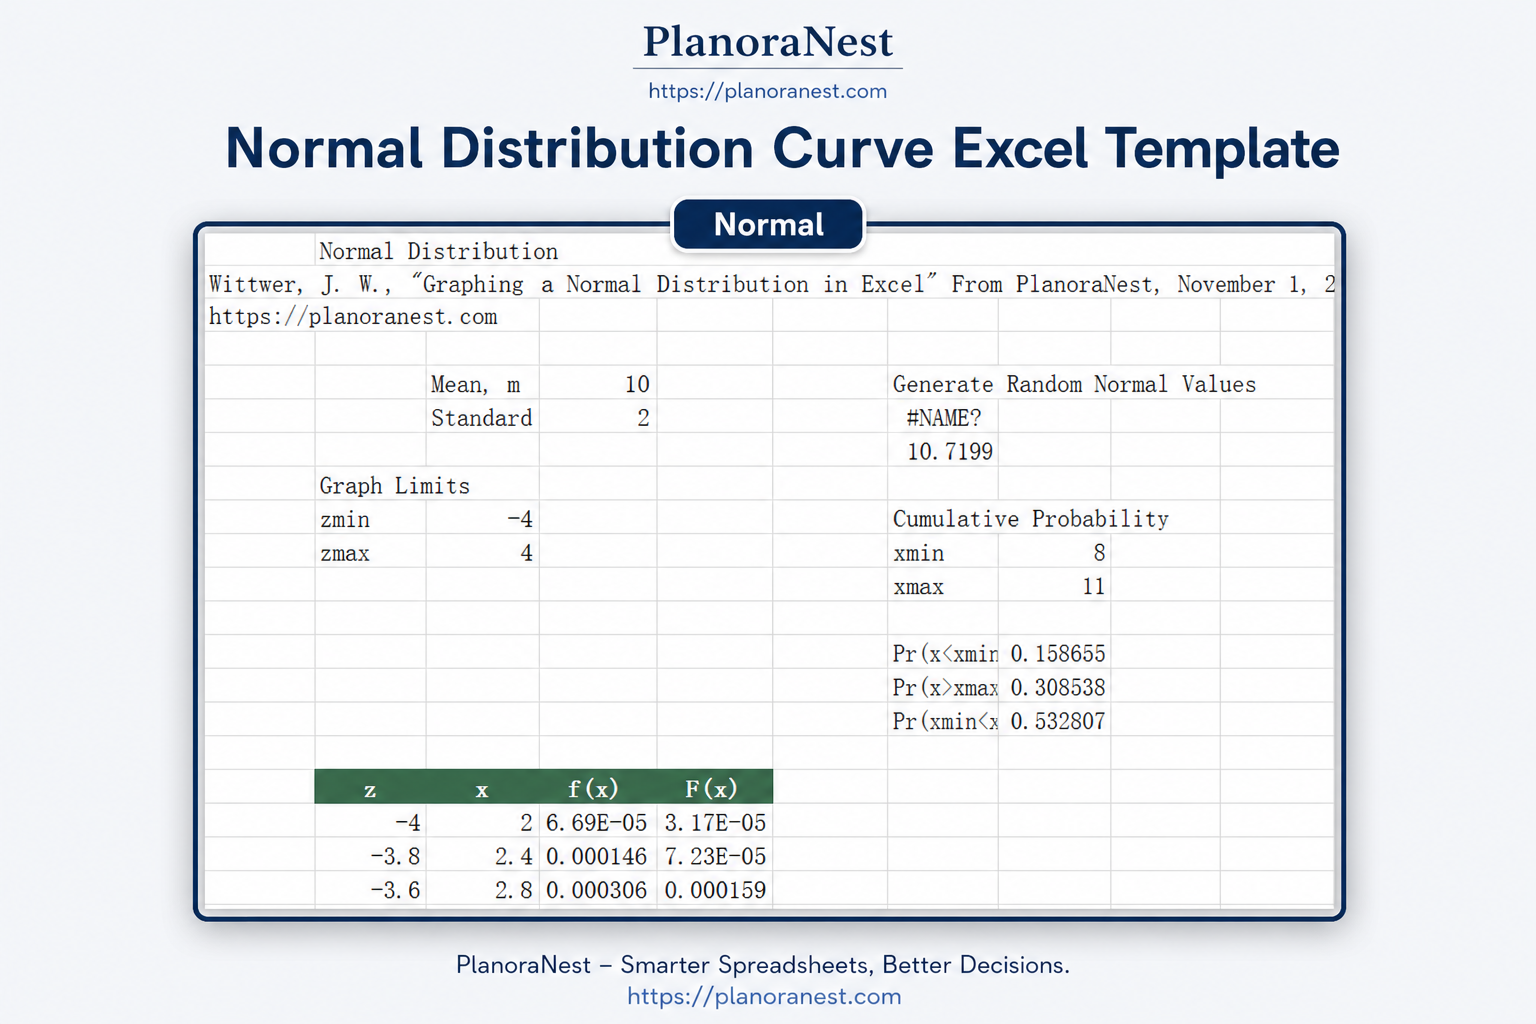
This normal distribution curve excel template from PlanoraNest gives you a ready-to-use Excel workbook for generating, visualizing, and analyzing normal (Gaussian) distributions. With a built-in z-score table spanning -4 to +4 standard deviations, cumulative probability calculations, and a random normal value generator, this template is a complete statistical tool for students, analysts, and researchers.
Whether you search for normal distribution excel template or google spreadsheet random normal distribution, this file works in Excel, Google Sheets, WPS Office -- one-time purchase at $3.9 (regularly $6.9), instant download, no subscription.
The file contains 3 sheets:
| Sheet | What it does |
|---|---|
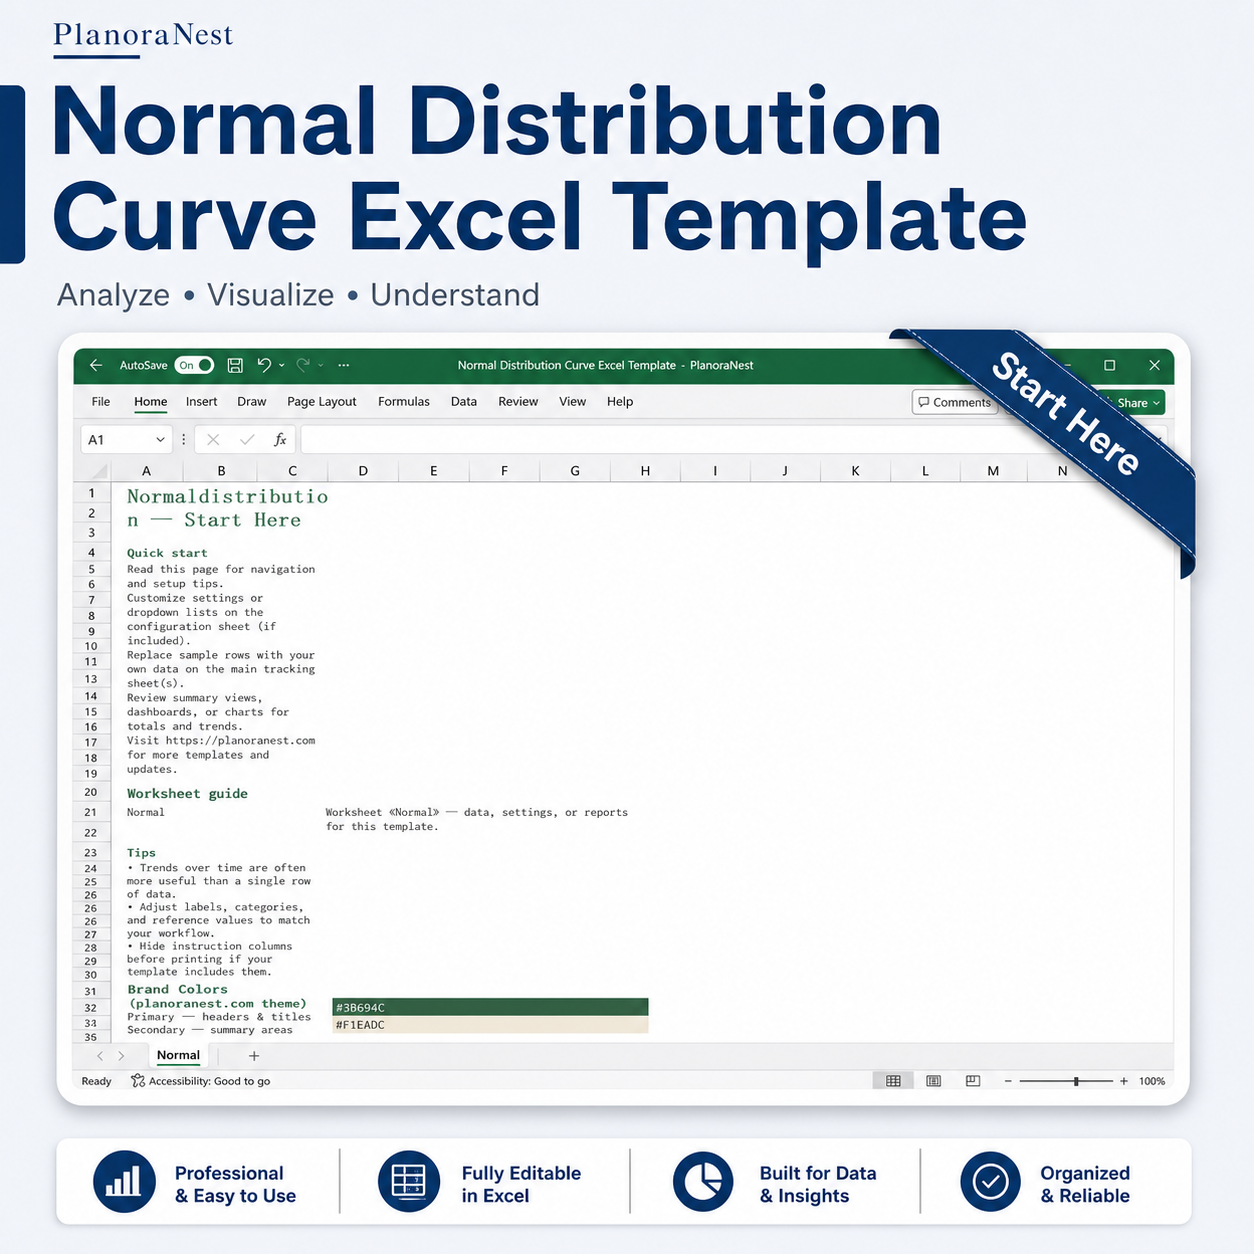
| Start Here | Quick-start guide with worksheet overview, usage tips, and PlanoraNest brand colors. |
| Normal | The core statistical sheet with: adjustable Mean and Standard Deviation parameters (default Mean=10, StdDev=2); Graph Limits (zmin=-4, zmax=4); a complete z-score table with 41+ rows covering z from -4 to +4 at 0.2 increments, with corresponding x values, probability density f(x), and cumulative probability F(x); cumulative probability calculations for xmin/xmax ranges; random normal value generator; and a cumulative probability graph data section. |
| About | Template attribution and license. |
See how each sheet looks before you download -- screenshots from the actual template.
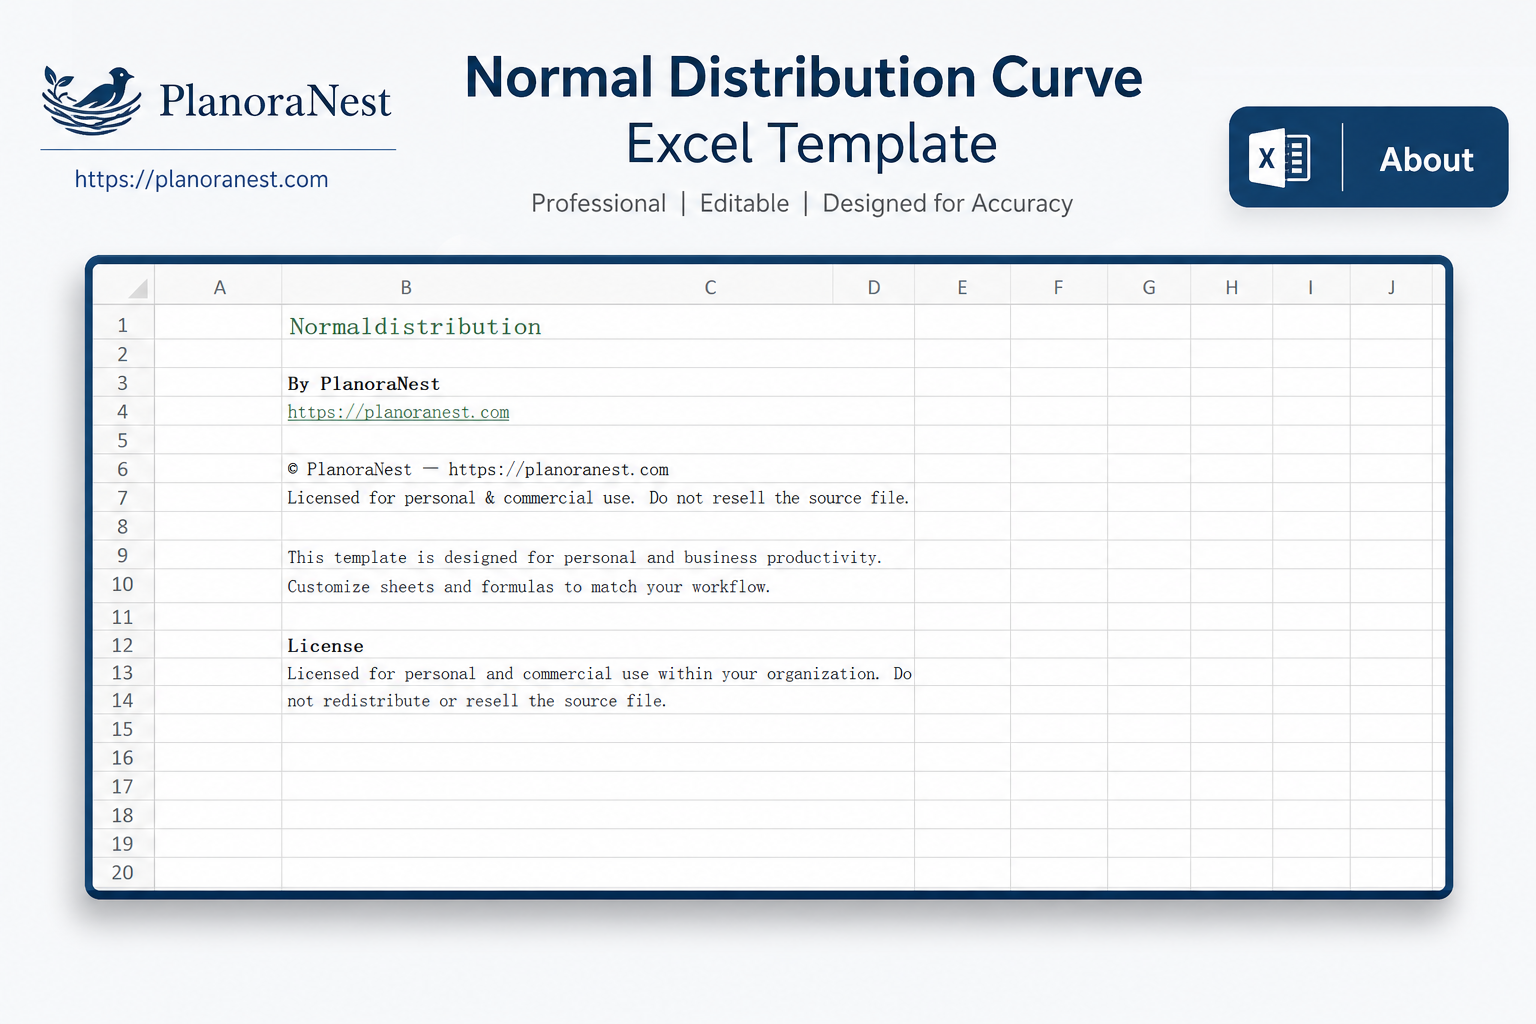
Preview of Normal Distribution Curve Excel Template | PlanoraNest Template
Preview of Normal Distribution Curve Excel Template | PlanoraNest Template
Preview of Normal Distribution Curve Excel Template | PlanoraNest Template
One-time purchase - $3.9 USD (regularly $6.9) - Instant download - No account required to use the file after purchase.
1. Purchase
Browse our shop and pick the templates that fit your needs — from business planners to productivity trackers.
2. Access
Since our products are digital, you'll receive immediate access after your purchase completes.
3. Use
Open your template in Google Sheets, Excel, or Notion and start using it right away with our included instructions.
Sarah Chen
Freelance consultant
Verified purchaseComprehensive and well-structured
I consult on process improvement projects and frequently need to demonstrate normal distribution concepts to clients who aren't statistically trained. This template is excellent for that. I set the Mean and StdDev to their actual process parameters, and the z-table with f(x) and F(x) columns gives me a full statistical picture in one sheet. I especially appreciate the Graph Limits (zmin/zmax) feature -- I can zoom into the range that matters for their process capability analysis. The cumulative probability section directly answers what percentage of output falls within spec -- which is exactly what my clients want to know.
Emily Hart
Virtual assistant
Verified purchaseGreat tool, takes a minute to understand
I needed a normal distribution curve for a client's quality report but hadn't worked with z-scores since college. Took me about 15 minutes of looking at the Normal sheet to understand the layout -- Mean and StdDev at the top, z-score table below, probability calculator on the right. Once I got oriented, it was straightforward: I set Mean to my process average and StdDev to my standard deviation, and the f(x) column gave me everything for the bell curve chart. The cumulative probability section was a bonus I didn't expect but ended up including in the report. Good value.
Tom Reyes
IT manager
Verified purchasePerfect for my statistics course
I'm taking a graduate-level stats course and this template was incredibly helpful for understanding normal distributions visually. Changing the Mean and StdDev in cells D5 and D6 and watching the entire z-score table recalculate was a lightbulb moment -- I could instantly see how the bell curve shifts and stretches. The cumulative probability calculator (Pr xmin < x < xmax) saved me from doing lookup tables by hand for homework problems. The Normal sheet has over 270 rows of computed data -- this is genuinely comprehensive. Best $3.9 I've spent on a study aid.