 Quick view
Vendor: PlanoNest
Excel Xy Scatter Plot With Standard Deviation Excel Template | PlanoraNest TemplateRegular price $6.90
Sale price $3.90
4.7 / 5.0 (3) total reviews
Vendor: PlanoNest
Regular price $6.90
Sale price $3.90
Excel
Quick sign in at checkout — your templates are saved to your library forever.
Related picks
Explore other digital products that pair well with this template.
Quick viewVendor: PlanoNest
Excel Xy Scatter Plot With Standard Deviation Excel Template | PlanoraNest TemplateRegular price $6.90
Sale price $3.90
 Quick view
Vendor: PlanoNest
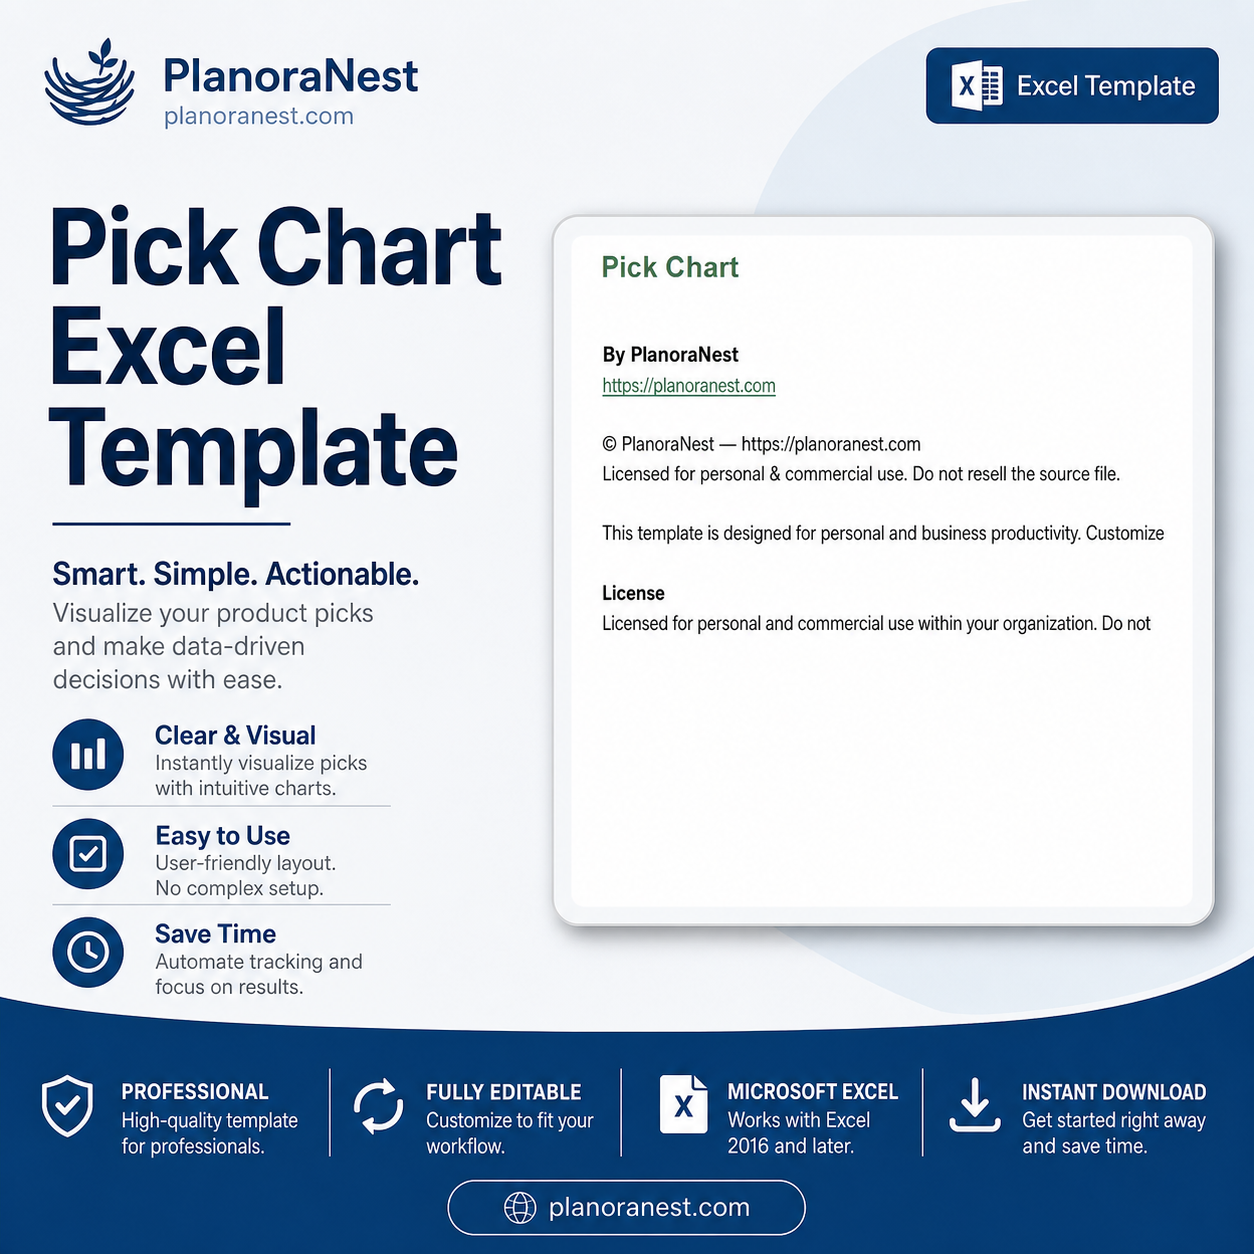
Pick Chart Excel Template | Pick Chart Template ExcelRegular price $6.90
Sale price $3.90
 Quick view
Vendor: PlanoNest
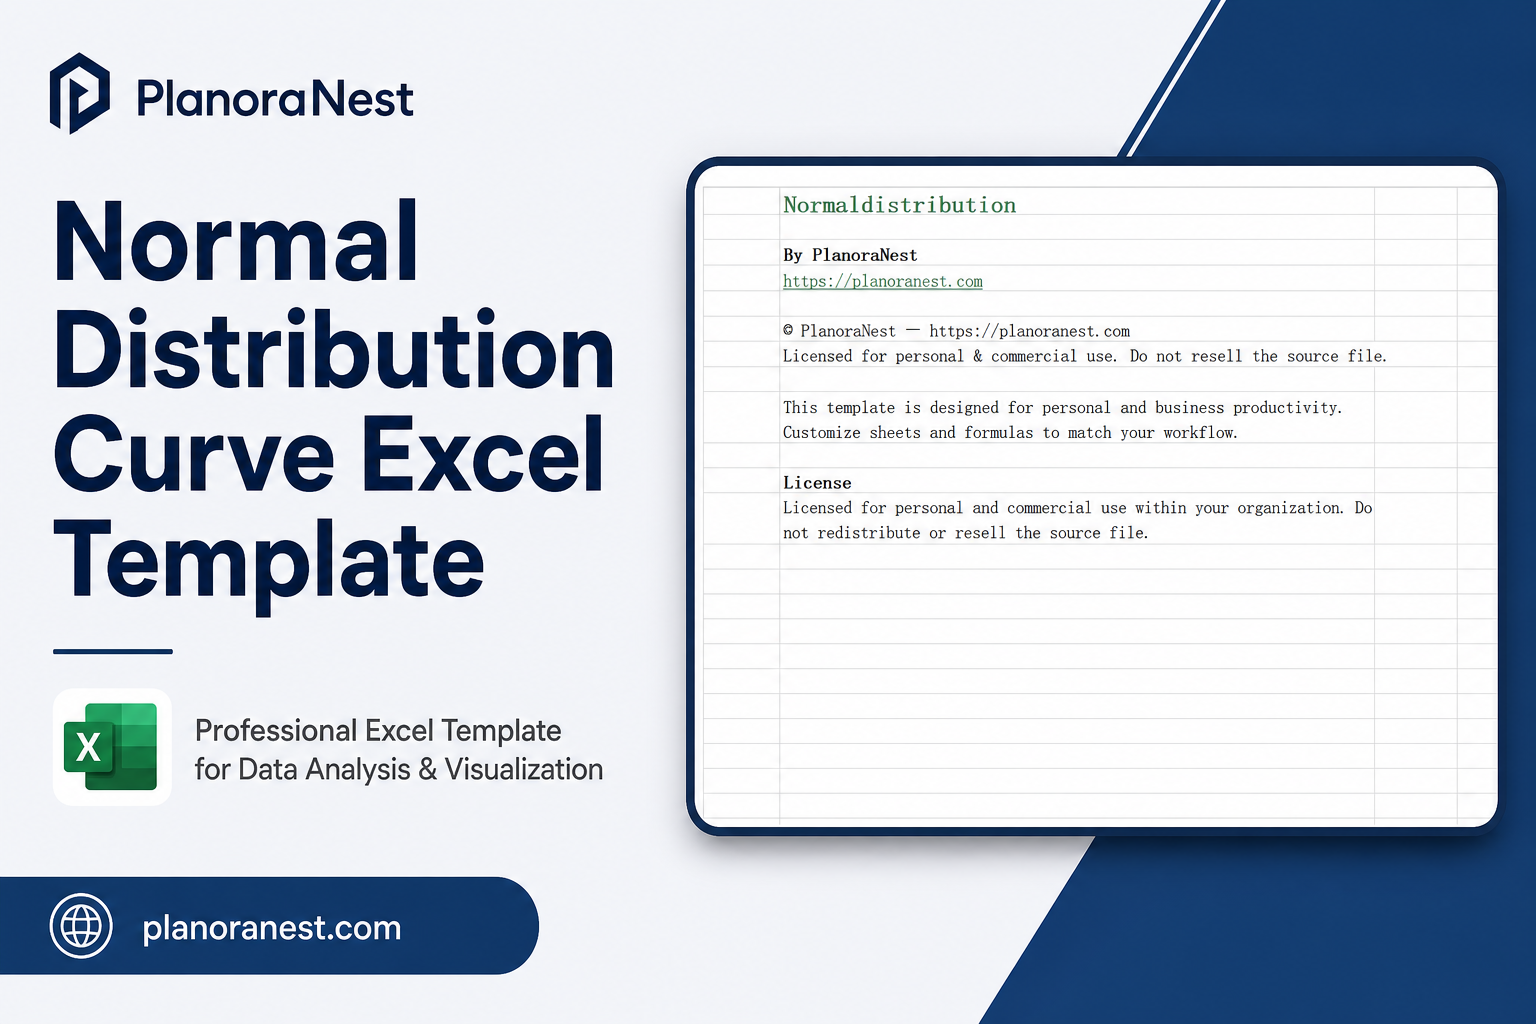
Normal Distribution Curve Excel Template | PlanoraNest TemplateRegular price $6.90
Sale price $3.90
 Quick view
Vendor: PlanoNest
Line Chart Excel Template | PlanoraNest TemplateRegular price $6.90
Sale price $3.90
 Quick view
Vendor: PlanoNest
Pie Chart Excel Template | PlanoraNest TemplateRegular price $6.90
Sale price $3.90
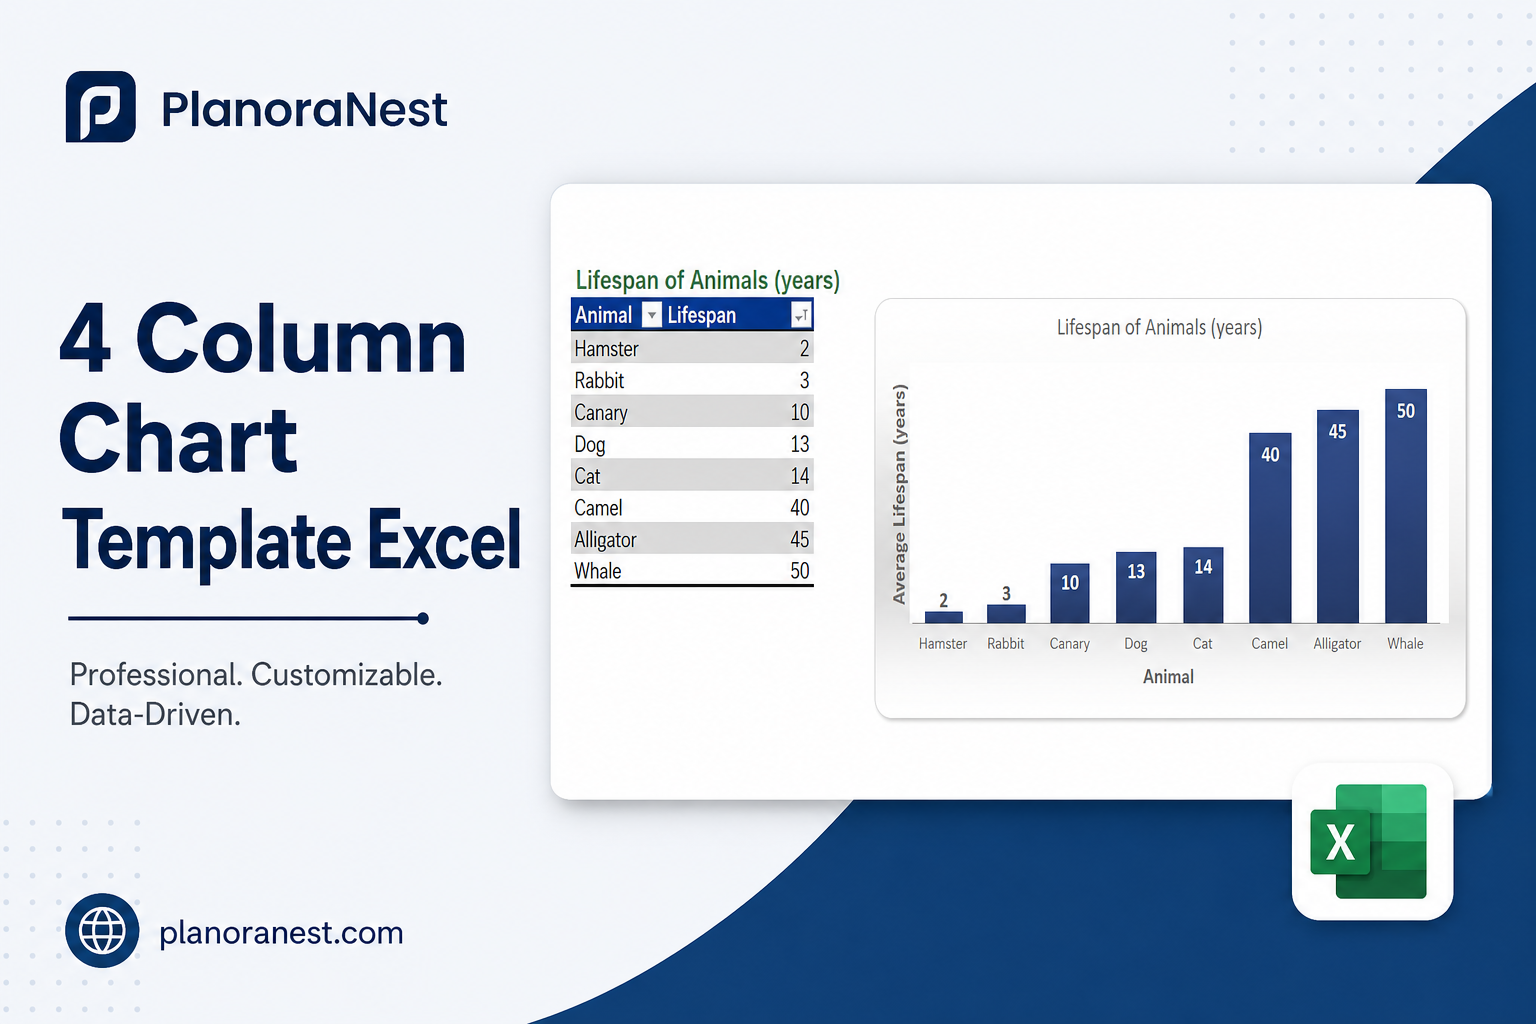
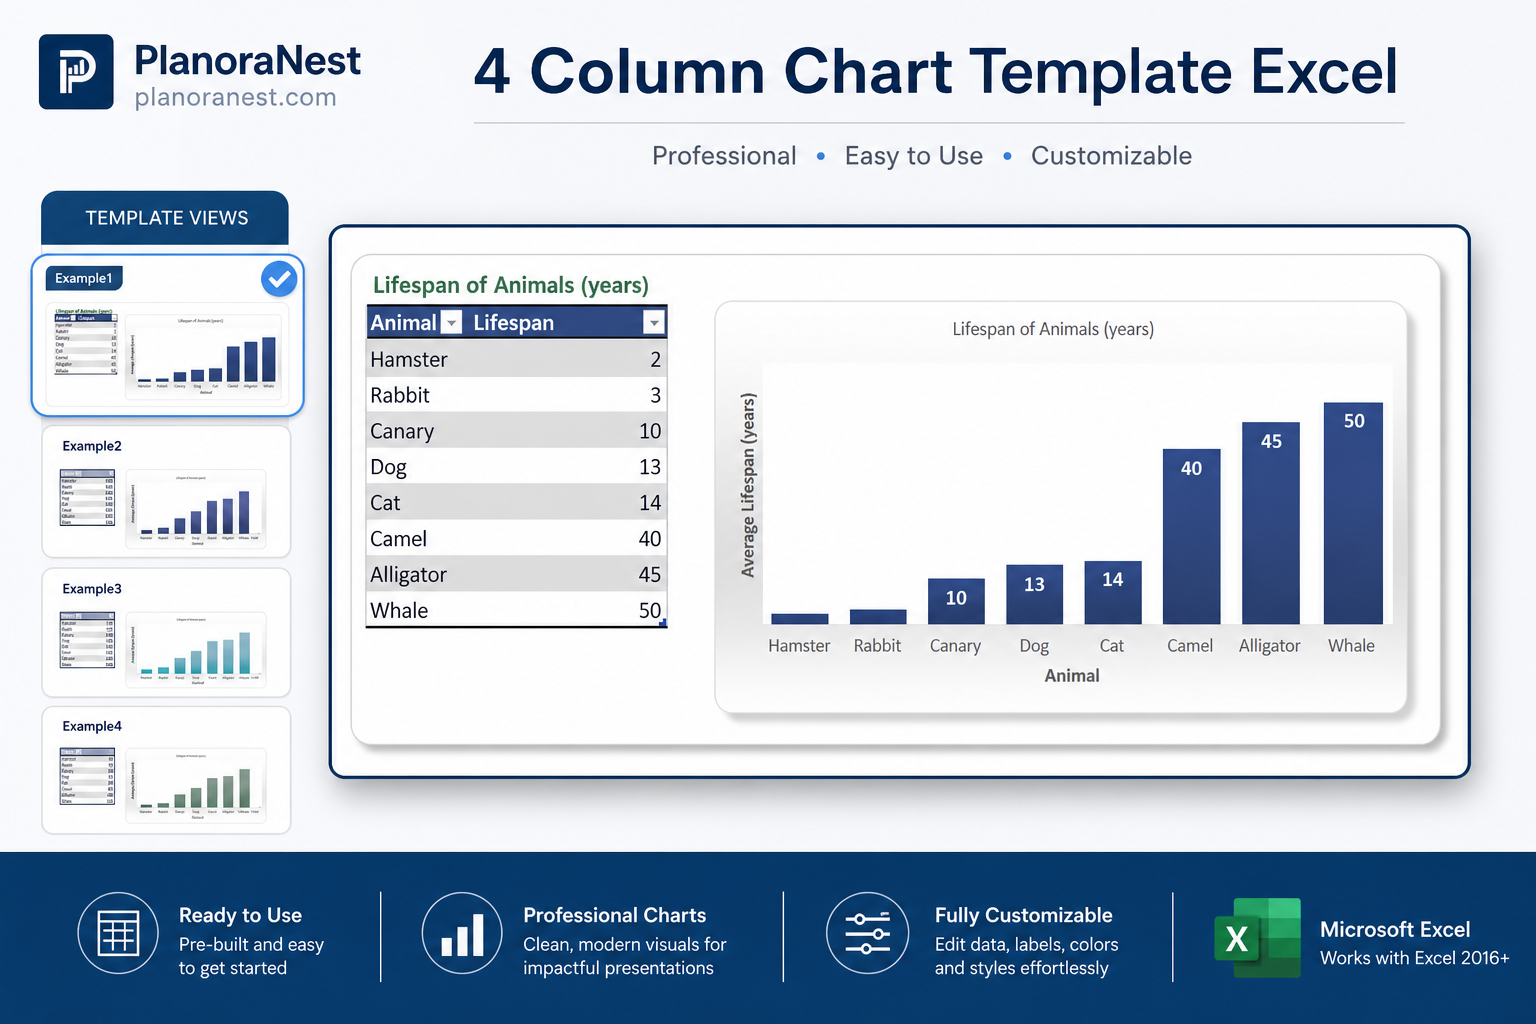
This 4 column chart template excel from PlanoraNest gives you a ready-to-use Excel workbook for building professional column charts in minutes. Whether you are comparing categories, visualizing survey results, or presenting business metrics, this template provides the structure and example data you need.
Whether you search for column percentage chart saving excel spreadsheet or google spreadsheet chart group by column, this file works in Excel, Google Sheets, and WPS Office — one-time purchase at $3.9 (regularly $6.9), instant download, no subscription.
This column chart template is a strong fit for:
The file contains 7 sheets, each designed for a specific purpose:
| Sheet | What it does |
|---|---|
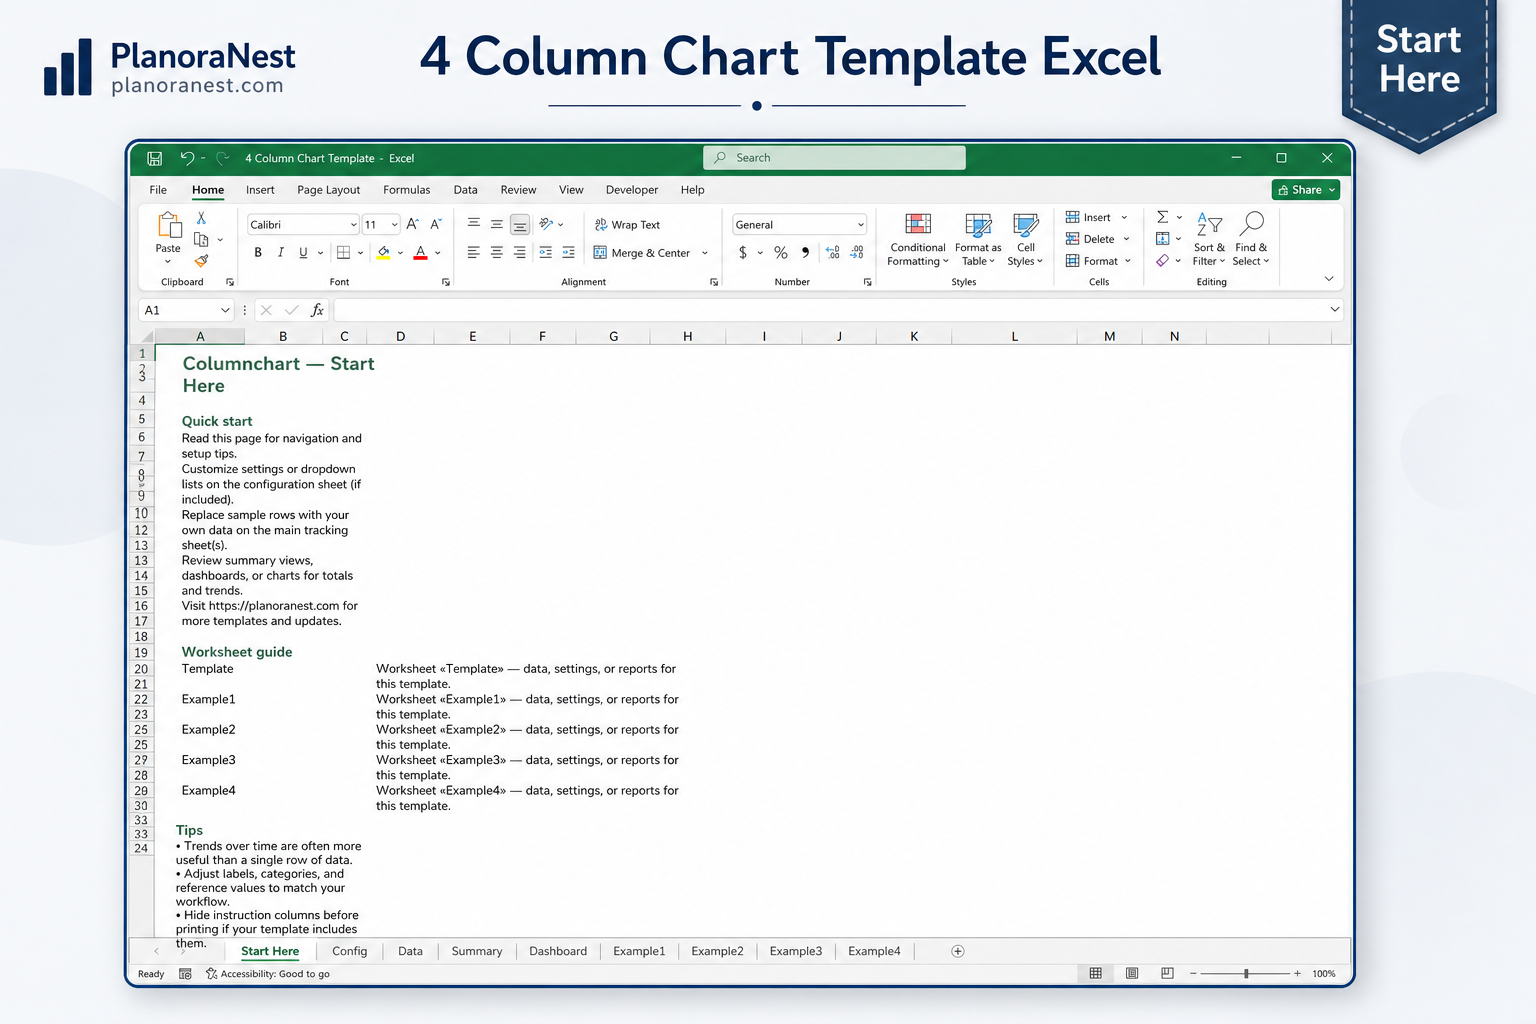
| Start Here | Quick-start guide with navigation tips, worksheet descriptions, and brand color reference. |
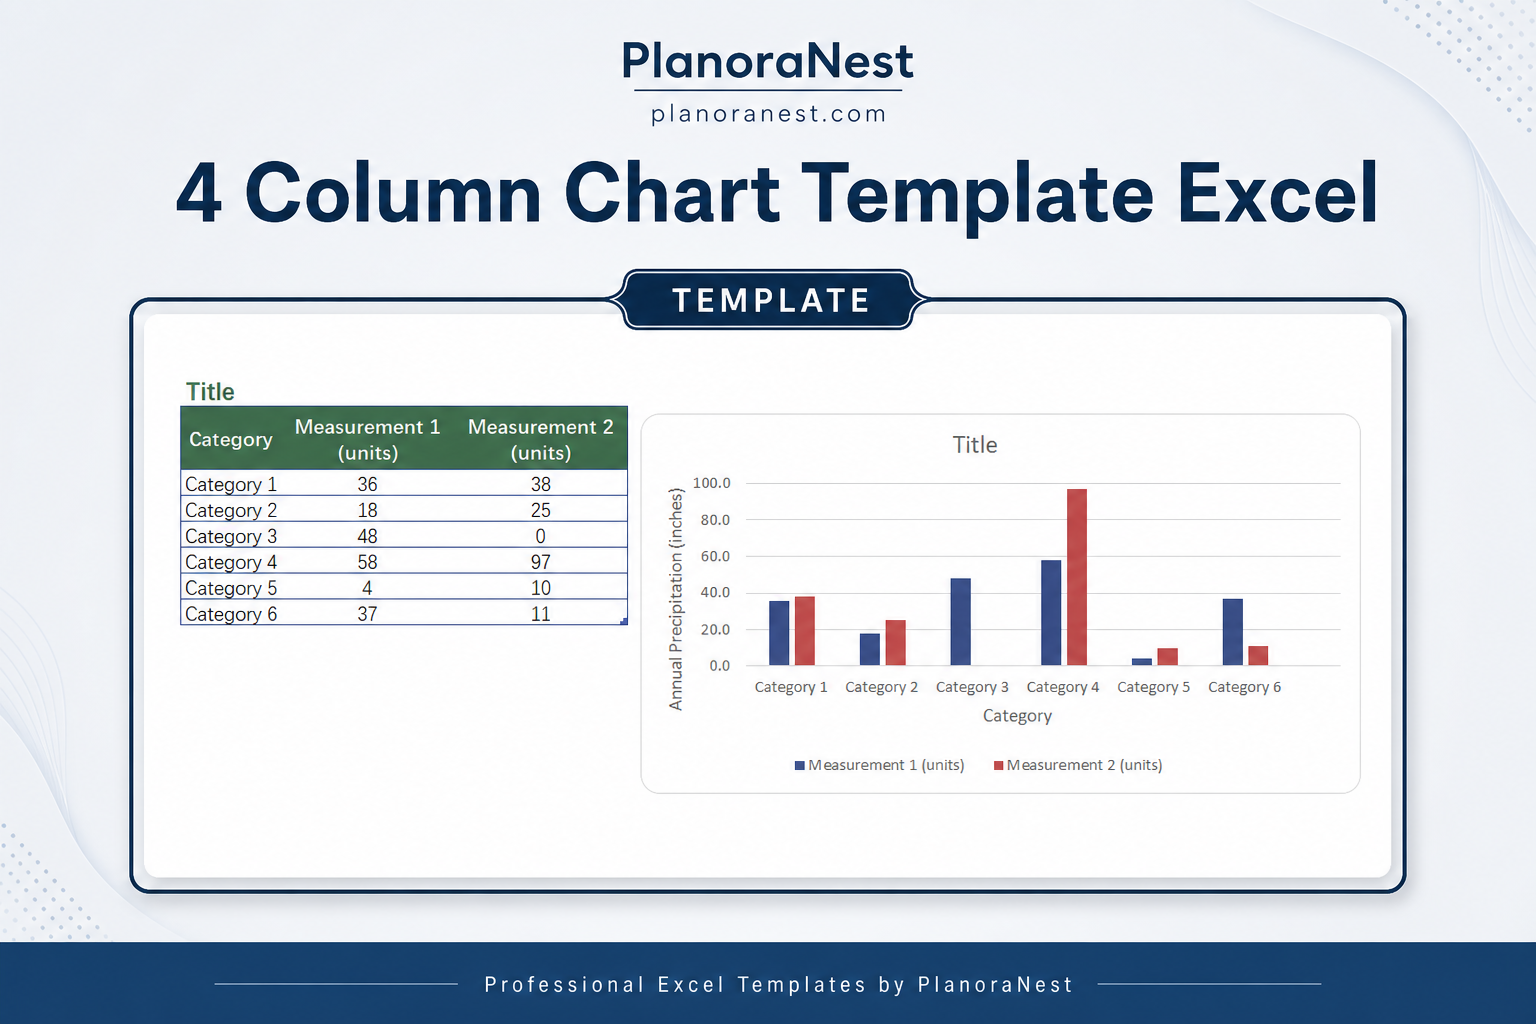
| Template | Blank column chart layout with Title, Category, Measurement 1, and Measurement 2 columns — enter your own labels and values to generate a grouped or clustered column chart. |
| Example1 | Lifespan of Animals dataset — compare lifespan in years across 8 animals (Hamster to Whale), ideal for a single-series column chart. |
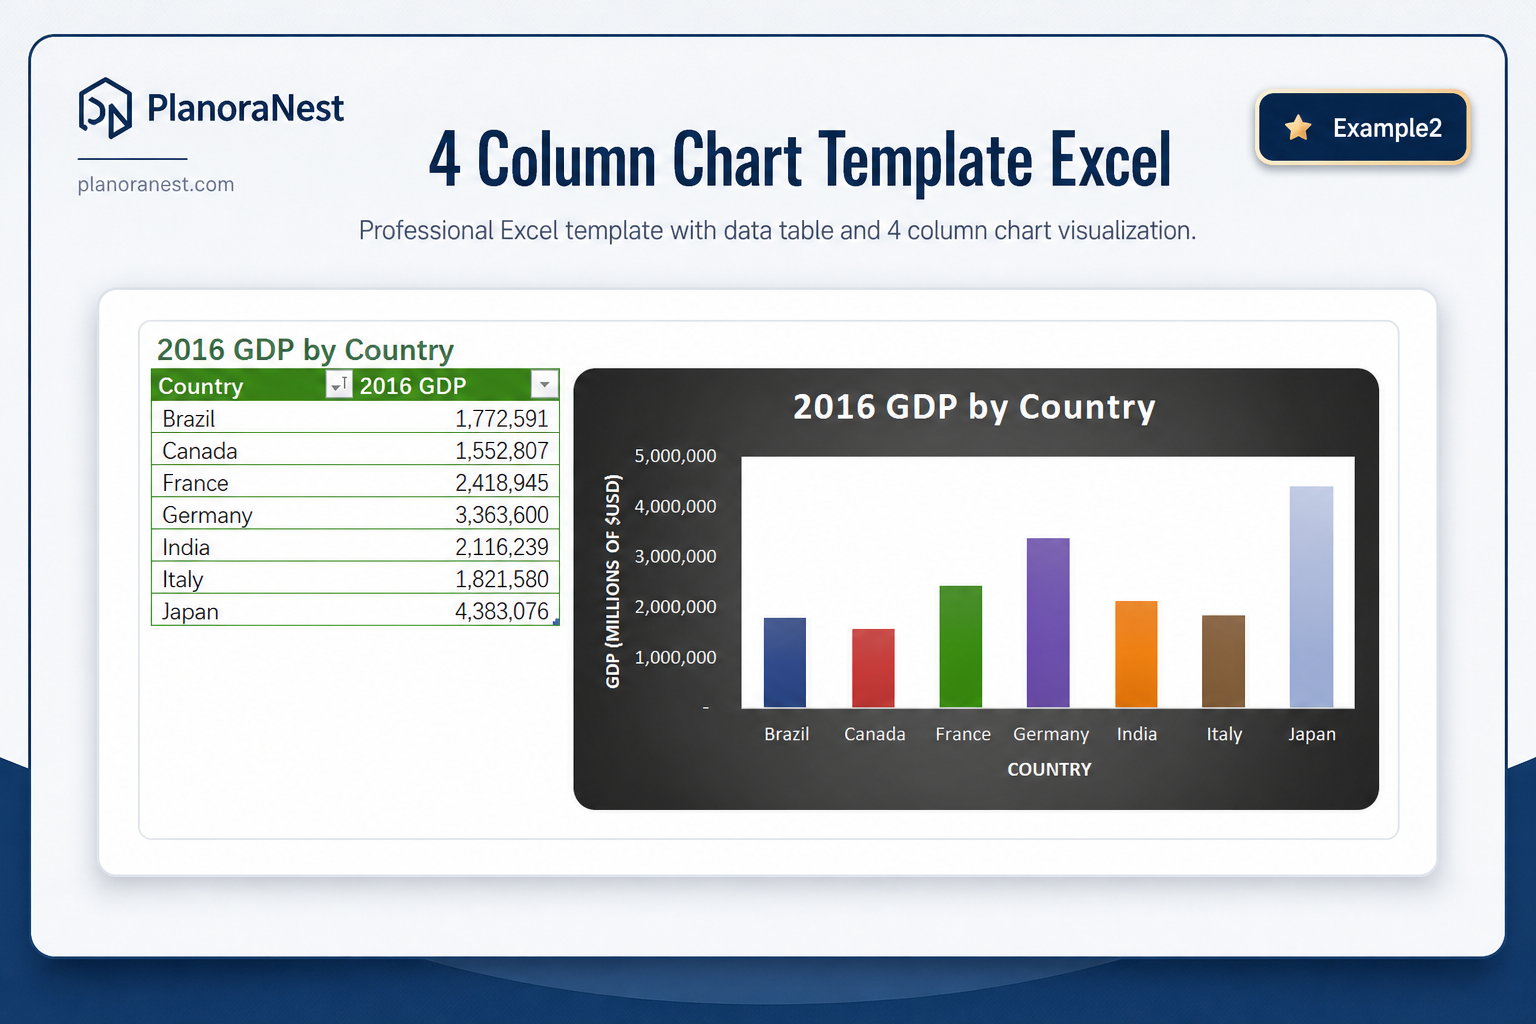
| Example2 | 2016 GDP by Country — 7 countries with GDP values in millions, perfect for presenting economic comparisons. |
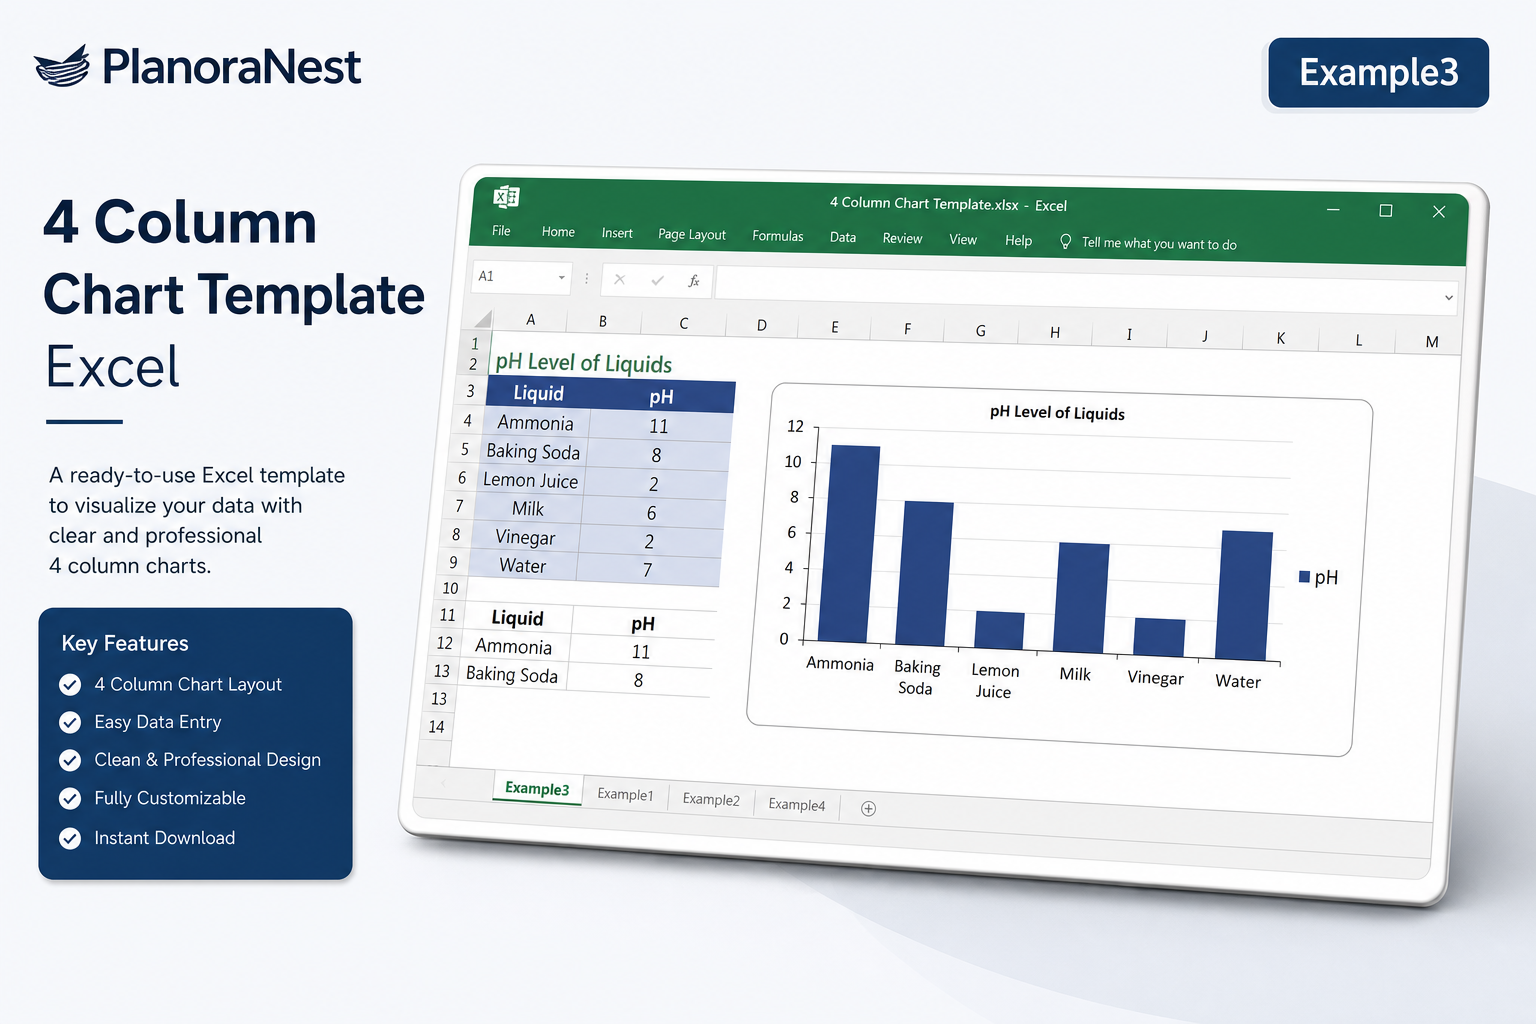
| Example3 | pH Level of Liquids — 6 common liquids with their pH values (Ammonia 11, Lemon Juice 2, Water 7), great for science or education contexts. |
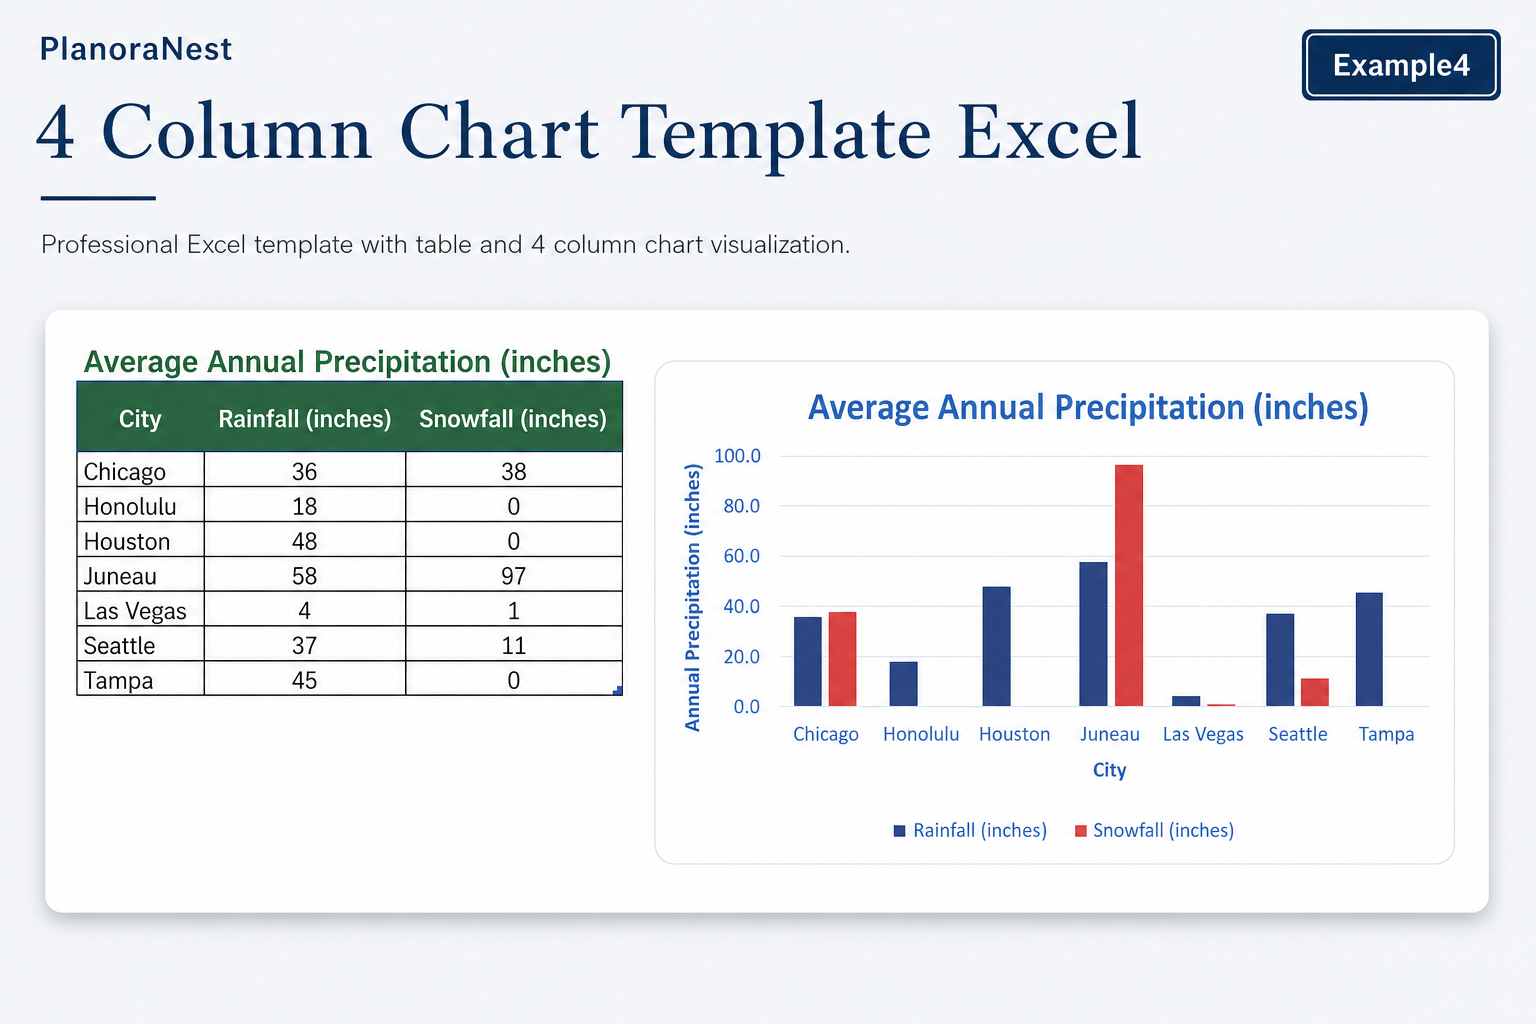
| Example4 | Average Annual Precipitation — 7 cities with both Rainfall (inches) and Snowfall (inches), designed for a grouped/clustered column chart with two data series. |
| About | Template attribution, license information, and link to PlanoraNest for more templates. |
See how each sheet looks before you download — screenshots from the actual template.
Preview of 4 Column Chart Template Excel | PlanoraNest Template
Preview of 4 Column Chart Template Excel | PlanoraNest Template
Preview of 4 Column Chart Template Excel | PlanoraNest Template
Preview of 4 Column Chart Template Excel | PlanoraNest Template
Preview of 4 Column Chart Template Excel | PlanoraNest Template
Preview of 4 Column Chart Template Excel | PlanoraNest Template
One-time purchase · $3.9 USD (regularly $6.9) · Instant download · No account required to use the file after purchase.
1. Purchase
Browse our shop and pick the templates that fit your needs — from business planners to productivity trackers.
2. Access
Since our products are digital, you'll receive immediate access after your purchase completes.
3. Use
Open your template in Google Sheets, Excel, or Notion and start using it right away with our included instructions.
Tom Reyes
Project coordinator
Verified purchaseGreat for my team's weekly reports
We use this every week now. I customized the Template sheet with our department categories and two KPI metrics, then shared it on OneDrive. My team fills in their numbers and the column chart updates automatically. The Start Here sheet's quick-start guide meant I didn't have to write any instructions — I just forwarded the file. The Example1 animal lifespan data was actually a fun way to show my team how the chart works before we plugged in our real numbers.
Priya Nair
Data analyst
Verified purchaseClean, well-structured, no fluff
I've downloaded a lot of Excel templates over the years and most are over-designed or packed with broken formulas. This one is refreshingly simple. 7 sheets total — a Start Here guide, one blank Template, 4 varied example sheets (GDP, pH, animal lifespans, precipitation), and an About page. The Example2 GDP sheet was a great reference for my own economic comparison project. At $3.9, it's an absolute steal.
Marcus Webb
Small business owner
Verified purchaseSaved me hours
I needed a column chart for my quarterly sales report and didn't want to start from a blank spreadsheet. This template gave me exactly what I needed — I opened the Example4 sheet (the precipitation one), swapped in my Q1-Q4 data with two product lines, and had a professional grouped column chart ready in 10 minutes. The Template sheet is clean, and having 4 different examples to reference was genuinely helpful for figuring out which layout worked best for my numbers.