 Quick view
Vendor: PlanoNest
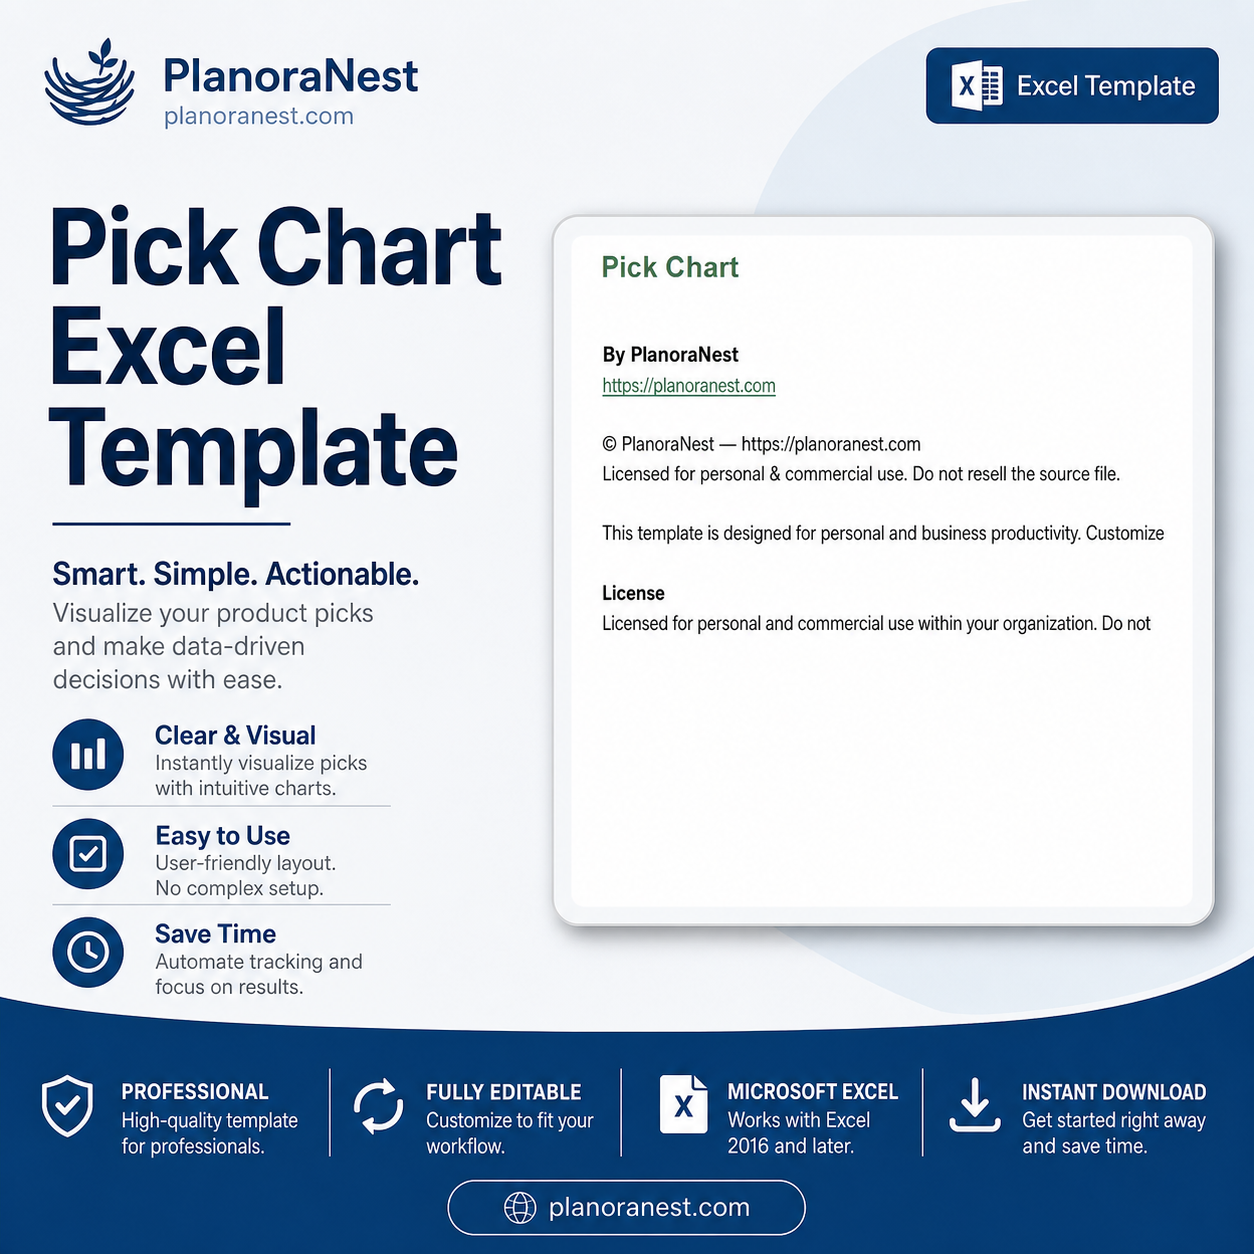
Pick Chart Excel Template | Pick Chart Template ExcelRegular price $6.90
Sale price $3.90
4.7 / 5.0 (3) total reviews
Vendor: PlanoNest
Regular price $6.90
Sale price $3.90
Excel
Quick sign in at checkout — your templates are saved to your library forever.
Related picks
Explore other digital products that pair well with this template.
Quick viewVendor: PlanoNest
Pick Chart Excel Template | Pick Chart Template ExcelRegular price $6.90
Sale price $3.90
 Quick view
Vendor: PlanoNest
Normal Distribution Curve Excel Template | PlanoraNest TemplateRegular price $6.90
Sale price $3.90
 Quick view
Vendor: PlanoNest
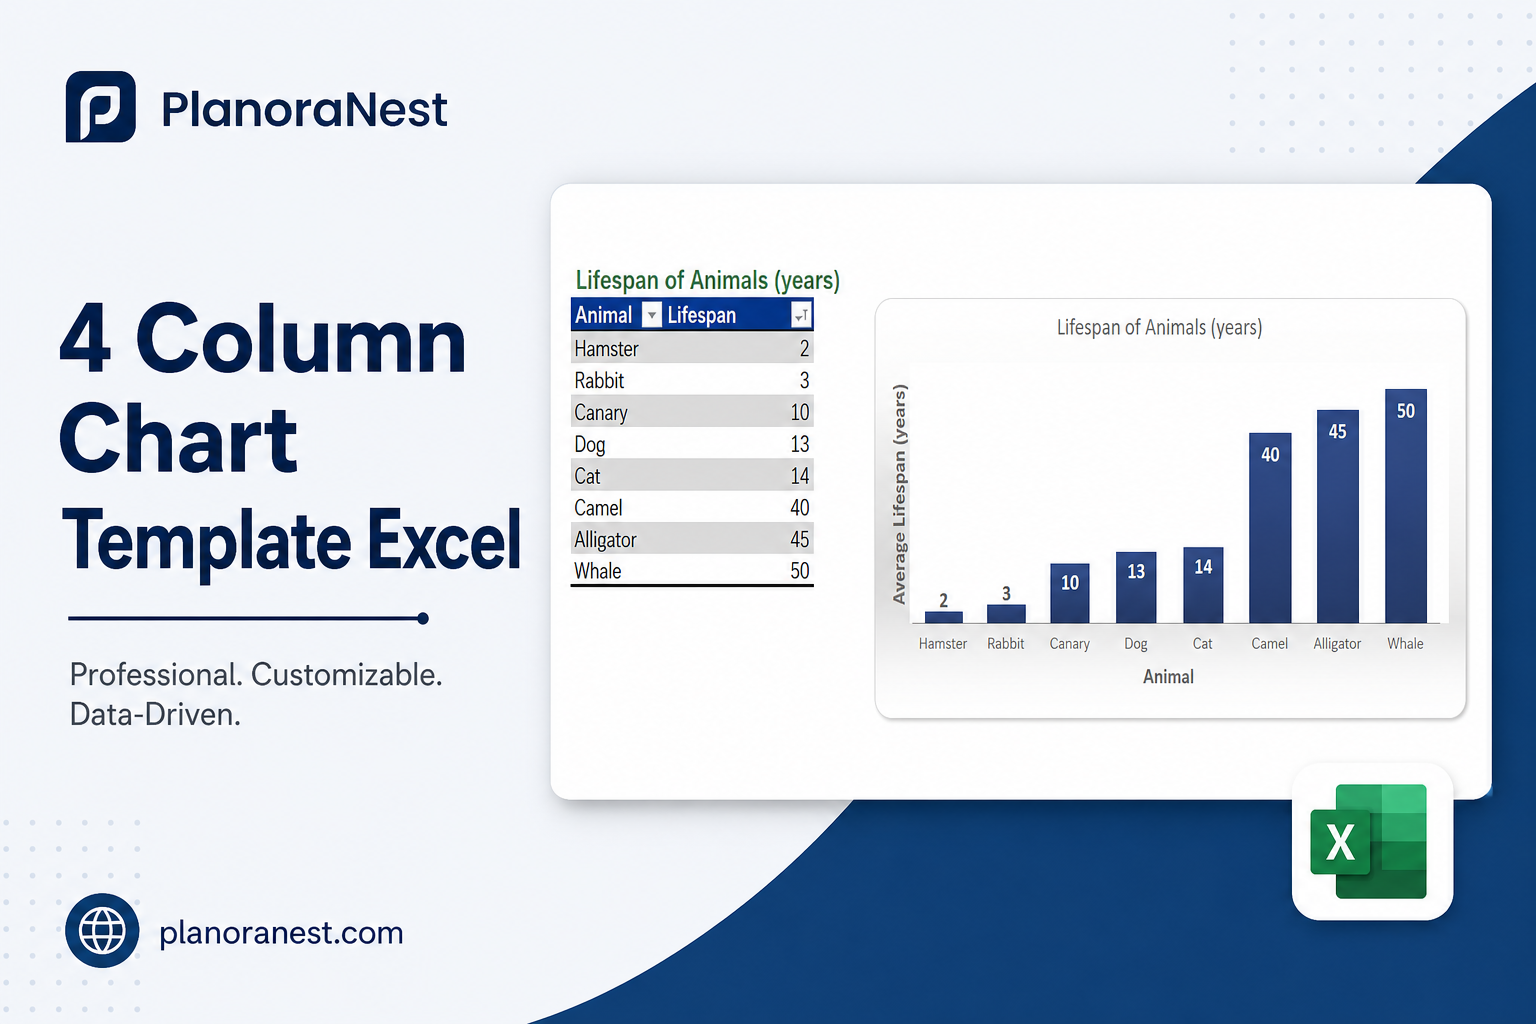
4 Column Chart Template Excel | PlanoraNest TemplateRegular price $6.90
Sale price $3.90
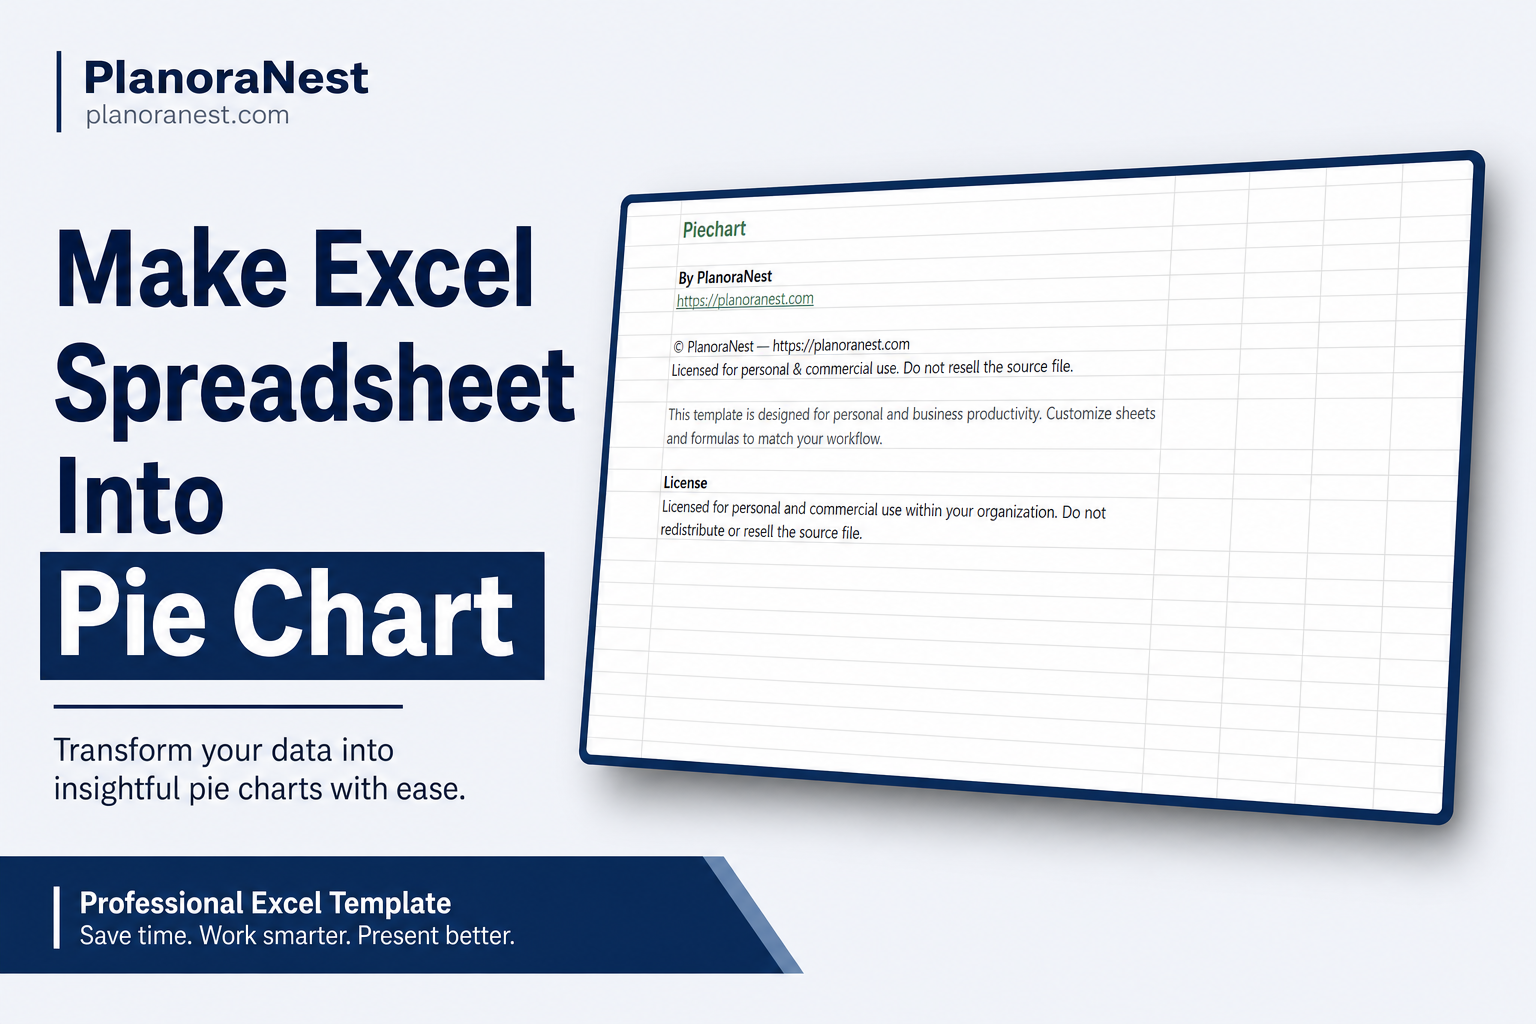
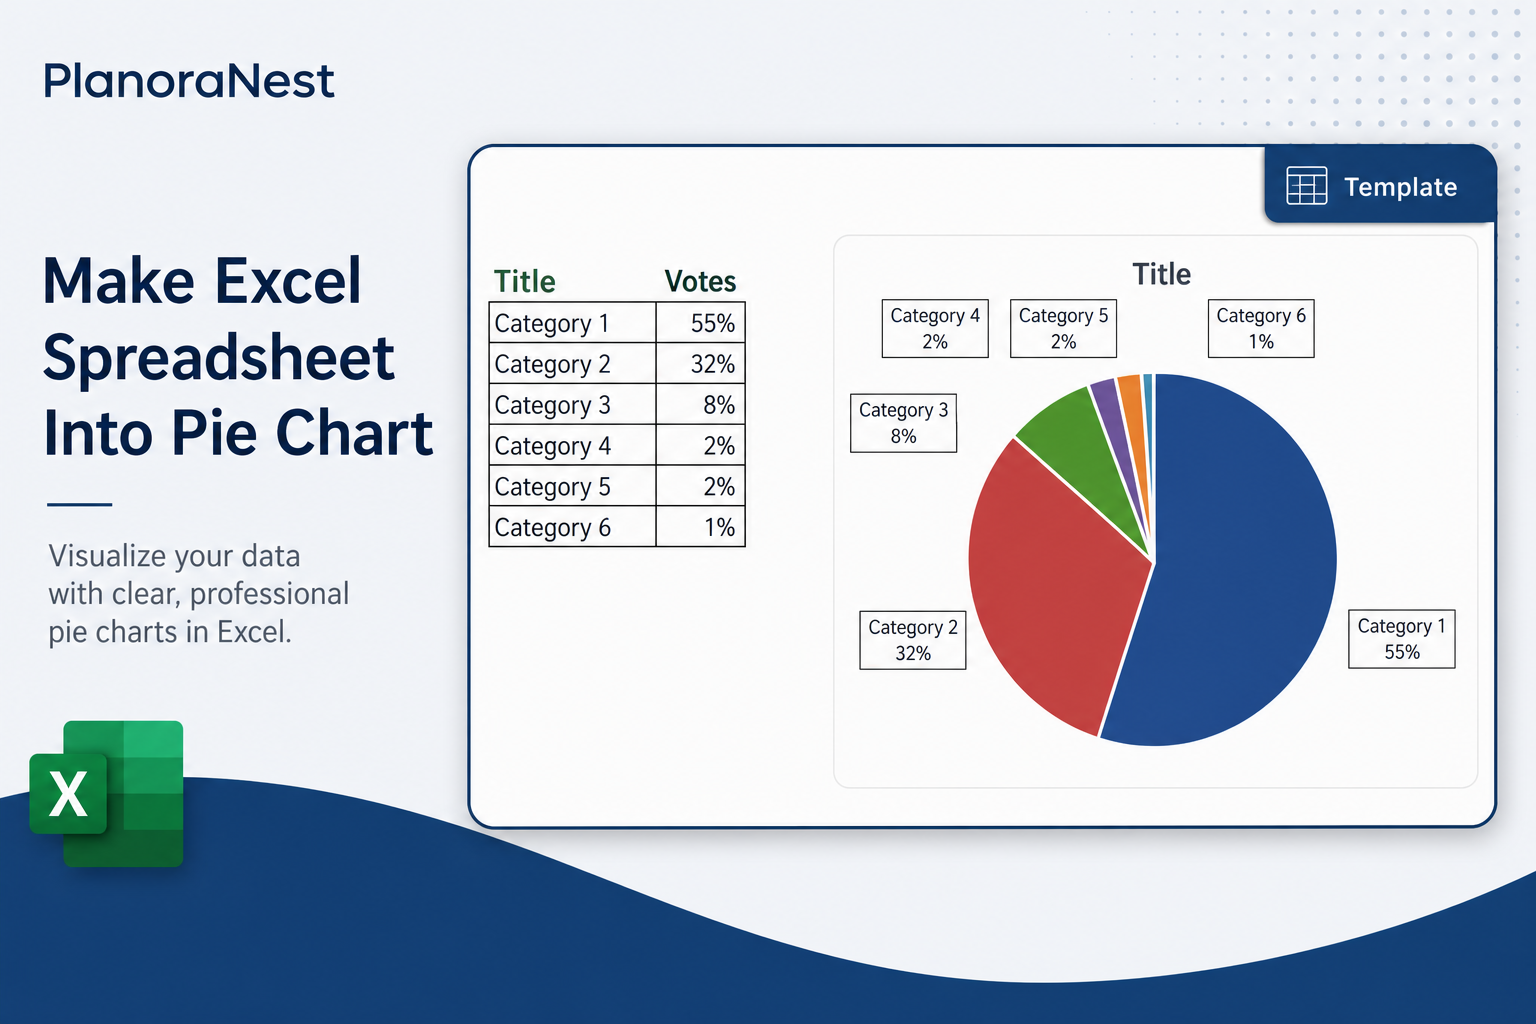
This make excel spreadsheet into pie chart template from PlanoraNest gives you a ready-to-use Excel workbook for creating professional pie charts from categorical data. With a blank template and multiple real-world example datasets, you can turn any spreadsheet data into a clear, visual proportional breakdown in minutes.
Whether you search for convert excel spreadsheet to pie chart or pie chart from excel spreadsheet, this file works in Excel, Google Sheets, WPS Office -- one-time purchase at $3.9 (regularly $6.9), instant download, no subscription.
The file contains 6 sheets:
| Sheet | What it does |
|---|---|
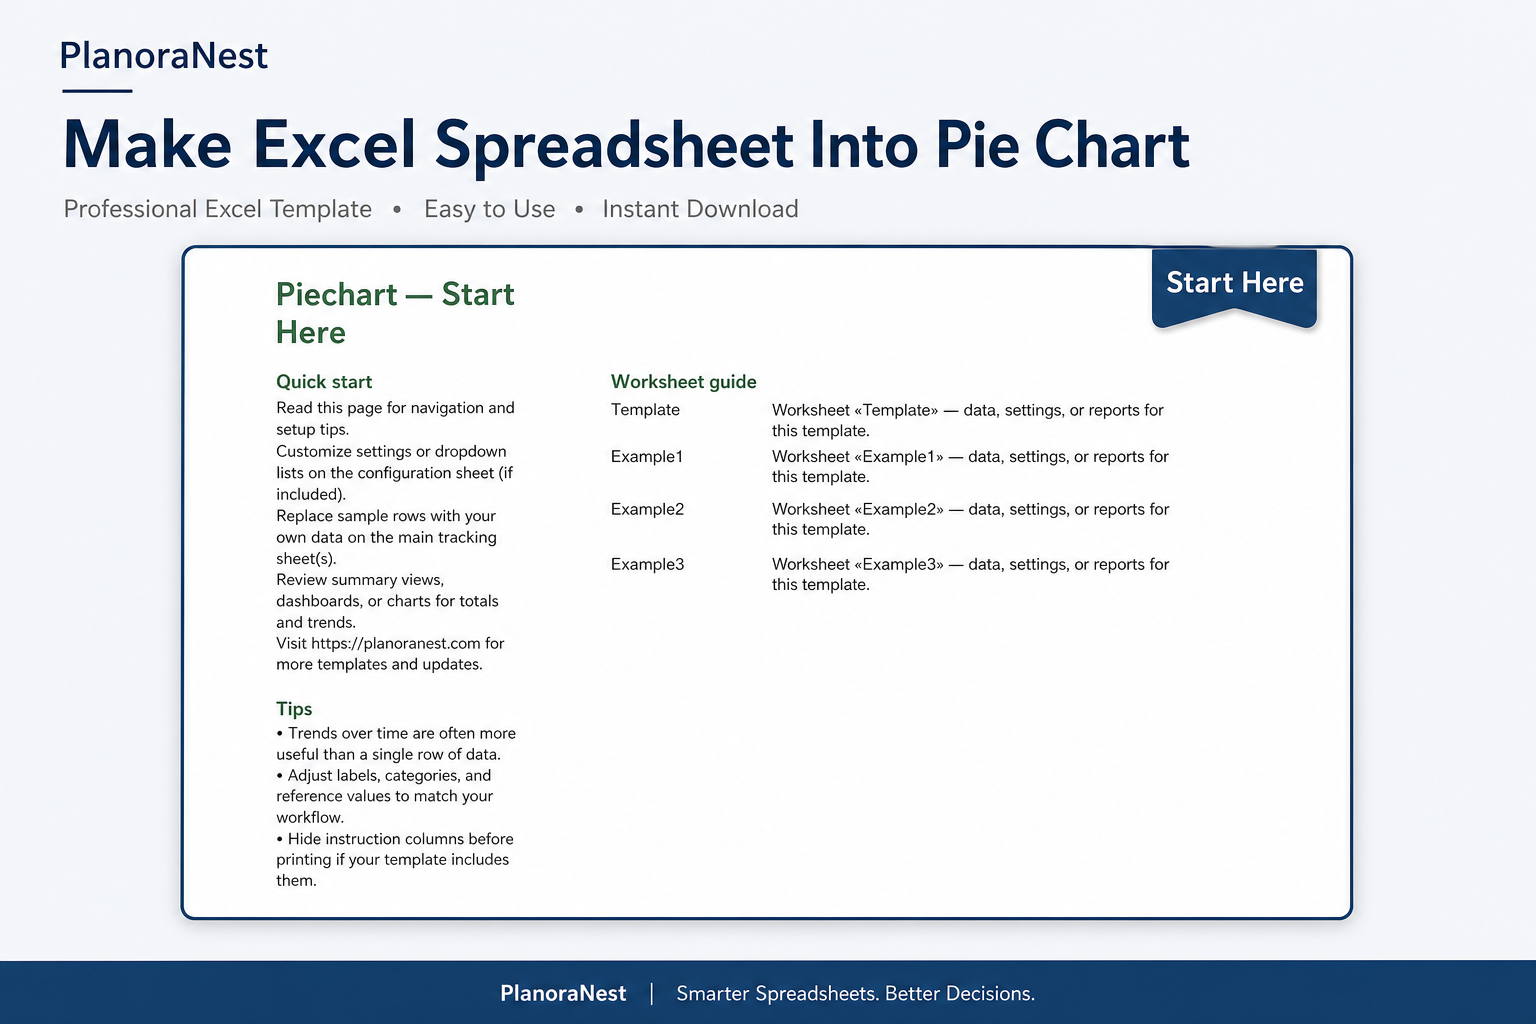
| Start Here | Quick-start guide with worksheet descriptions, tips, and PlanoraNest brand colors. |
| Template | Blank pie chart layout with a Title row and Category/Votes columns -- 6 pre-formatted category rows plus percentage-format numbers. Replace labels and values with your own data. |
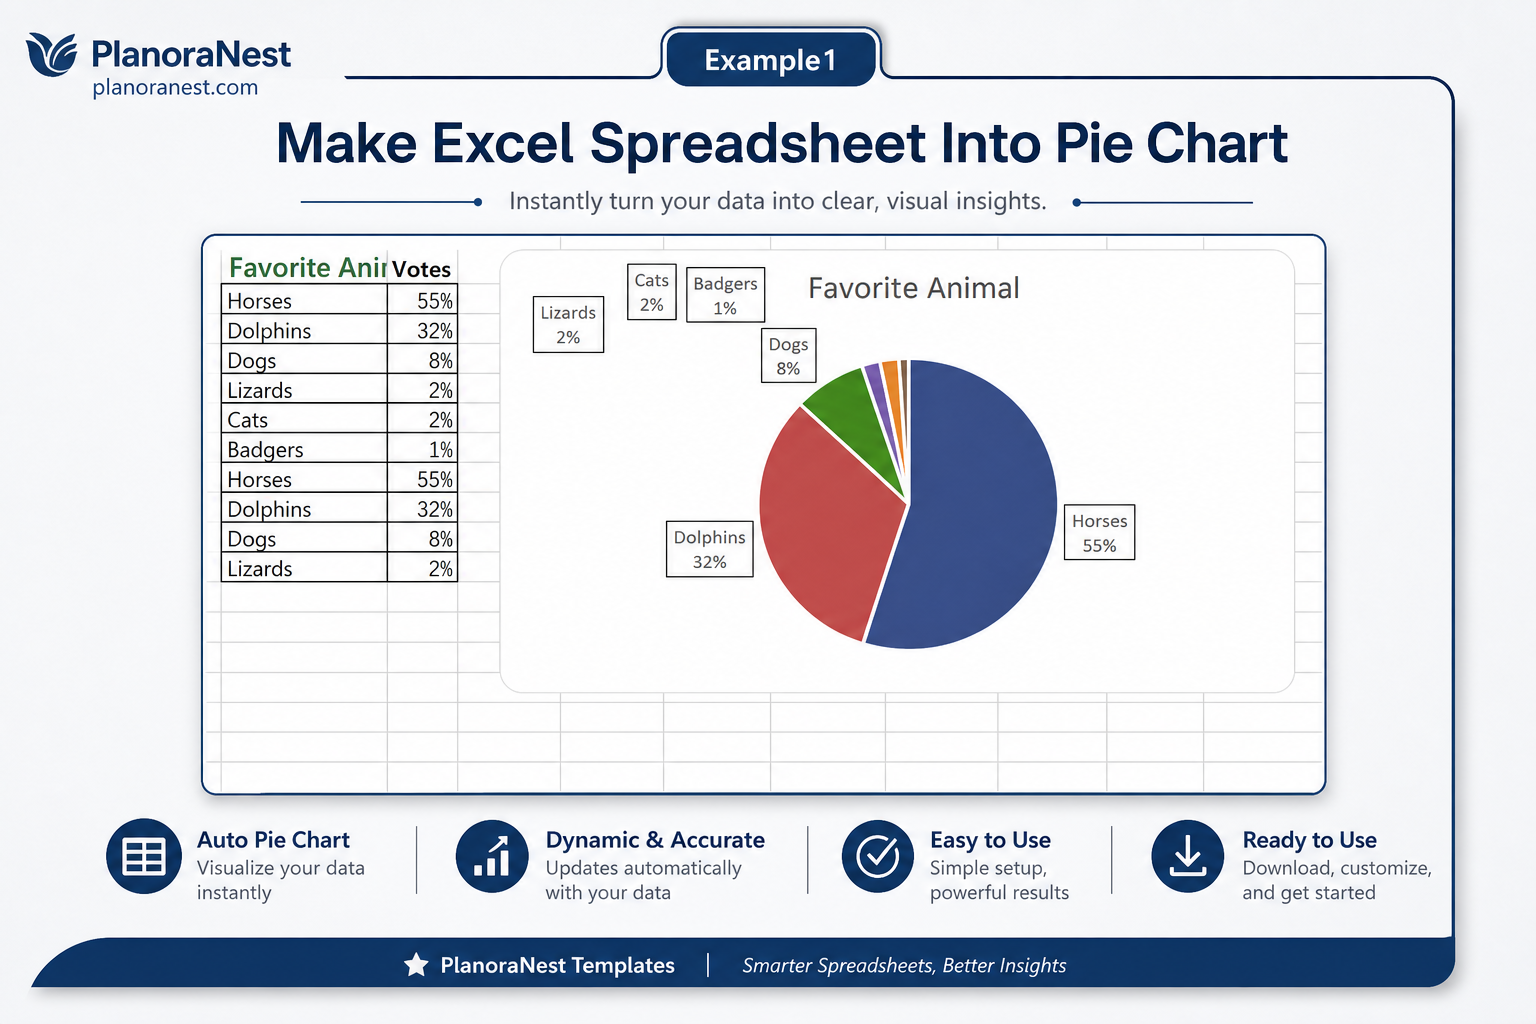
| Example1 | Favorite Animal survey -- 7 animals (Horses 55%, Dolphins 32%, Dogs 8%, etc.) with proportional vote data, perfect for a classic survey pie chart. |
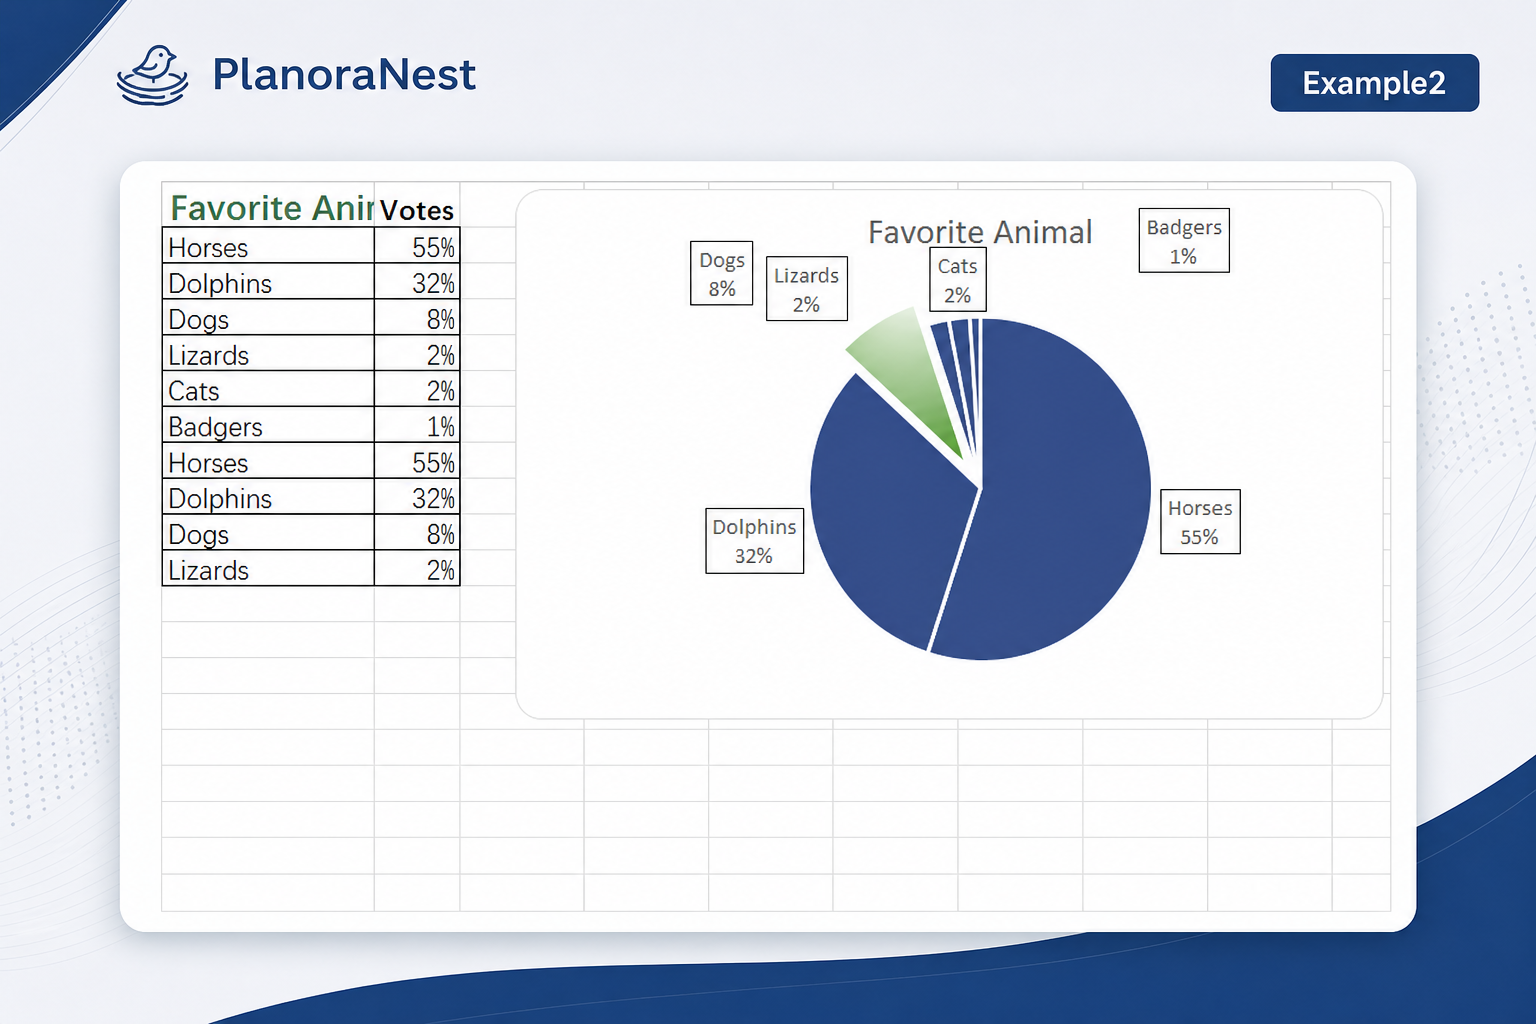
| Example2 | Favorite Animal (same dataset, alternate format) -- identical structure to Example1 for practicing or comparing chart formatting options. |
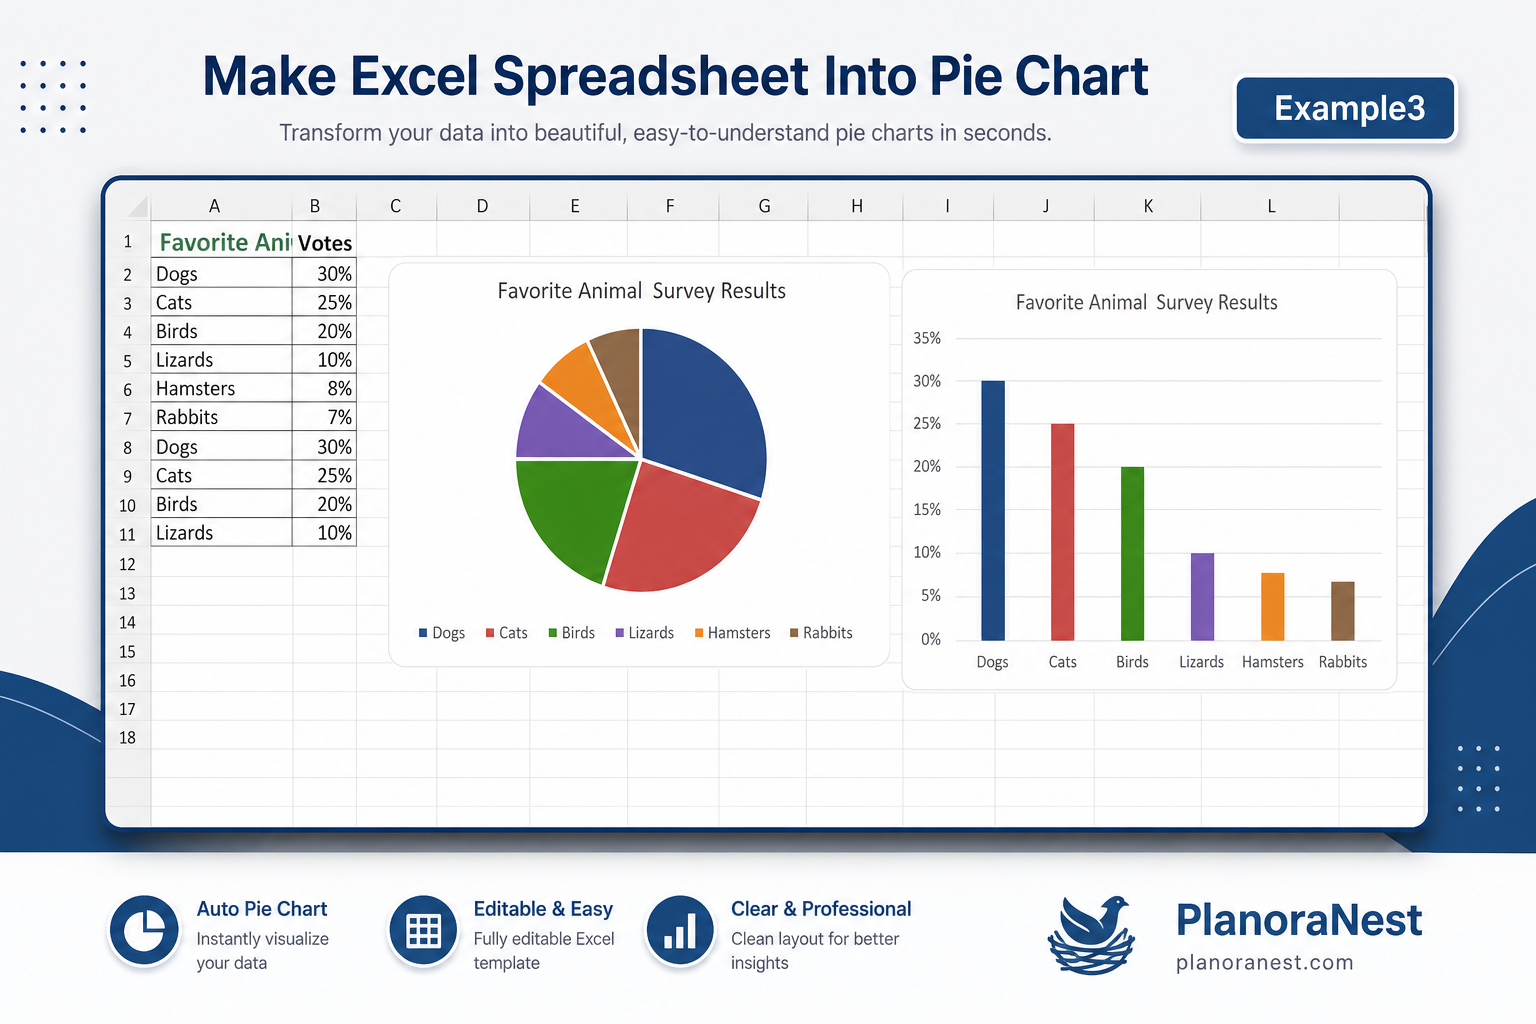
| Example3 | Alternate pet preference survey -- 7 different animals (Dogs 30%, Cats 25%, Birds 20%, Lizards 10%, Hamsters 8%, Rabbits 7%), showing how a different distribution changes the pie proportions. |
| About | Template attribution and license. |
See how each sheet looks before you download -- screenshots from the actual template.
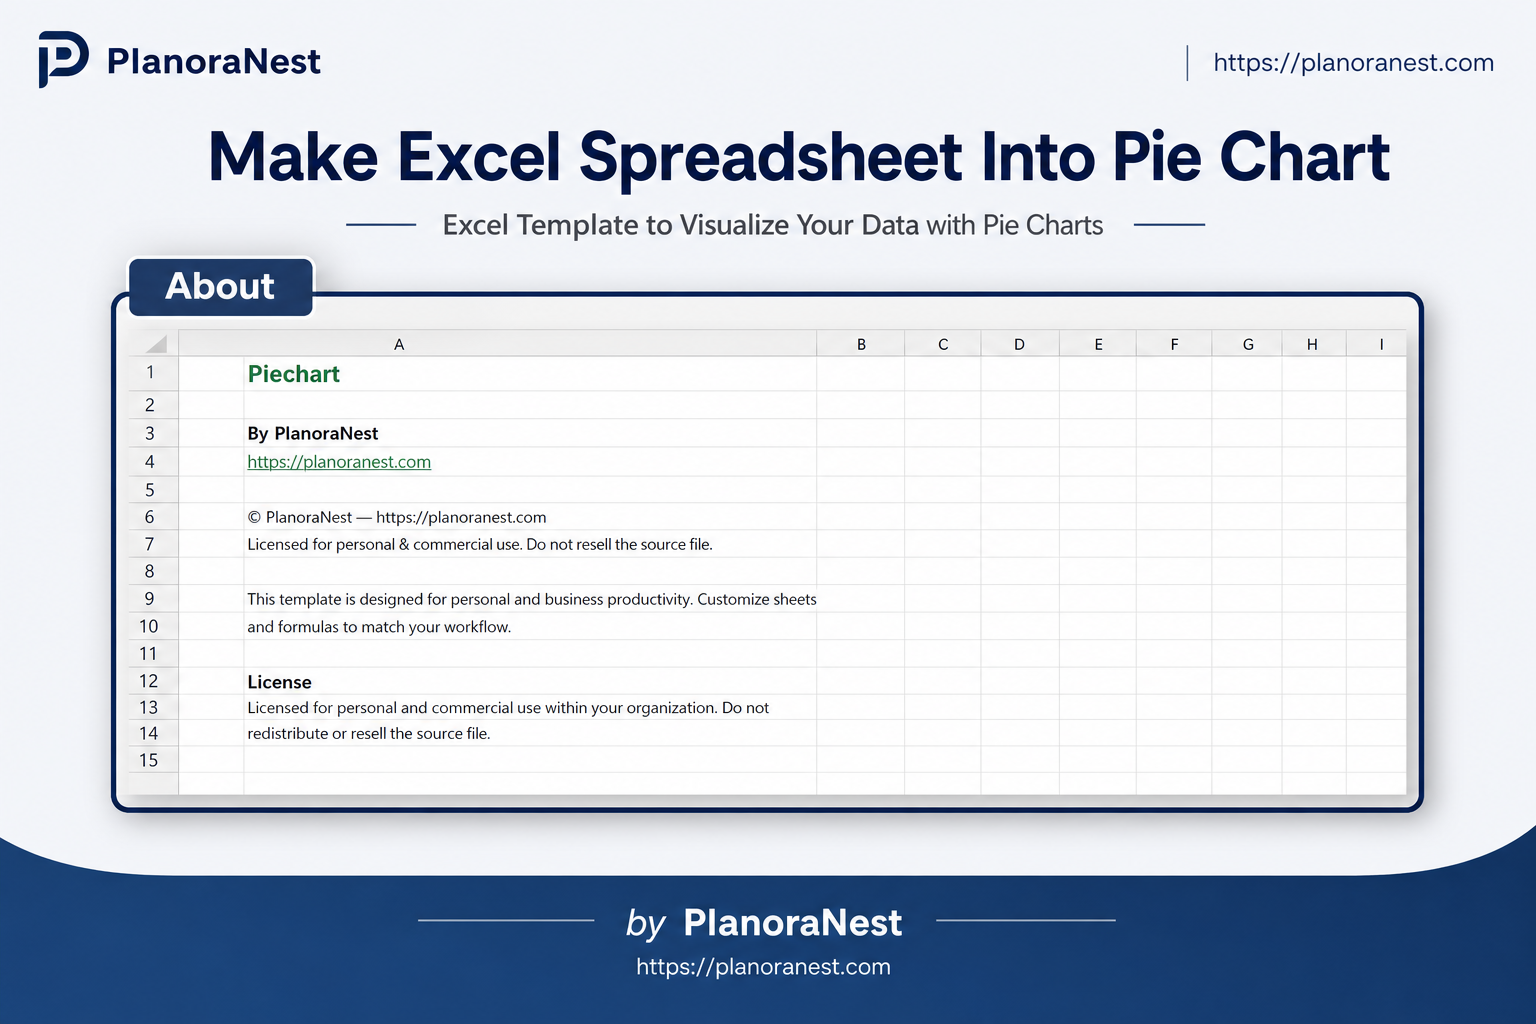
Preview of Make Excel Spreadsheet Into Pie Chart | PlanoraNest Template
Preview of Make Excel Spreadsheet Into Pie Chart | PlanoraNest Template
Preview of Make Excel Spreadsheet Into Pie Chart | PlanoraNest Template
Preview of Make Excel Spreadsheet Into Pie Chart | PlanoraNest Template
Preview of Make Excel Spreadsheet Into Pie Chart | PlanoraNest Template
Preview of Make Excel Spreadsheet Into Pie Chart | PlanoraNest Template
One-time purchase - $3.9 USD (regularly $6.9) - Instant download - No account required to use the file after purchase.
1. Purchase
Browse our shop and pick the templates that fit your needs — from business planners to productivity trackers.
2. Access
Since our products are digital, you'll receive immediate access after your purchase completes.
3. Use
Open your template in Google Sheets, Excel, or Notion and start using it right away with our included instructions.
Jenna Alvarez
Operations coordinator
Verified purchaseGood, wish there were more chart types
This template does exactly what it promises -- turns spreadsheet data into a pie chart, fast. I used it for our department's budget allocation breakdown and it looked clean and professional with the default formatting. The 3 example sheets are genuinely useful for reference. My only suggestion: it would be nice if the template also included a bar chart or donut chart variation on the same data, since some presentations need variety. But for a pure pie chart template at $3.9, I can't complain. I'll reuse it for quarterly reports.
Marcus Webb
Small business owner
Verified purchaseClean and practical
I run a small retail shop and wanted a pie chart for our product category sales breakdown to share with my team. I'm not an Excel person -- I opened this template, went to the Template sheet, replaced the 6 categories with my product types and the votes with my sales percentages, and had a pie chart in literally 5 minutes. The Example3 sheet (Dogs 30%, Cats 25%, etc.) was helpful because my data distribution looked similar. No formulas to break, no confusing settings. Just works.
Chris Mueller
Independent contractor
Verified purchaseSaved me hours on client reports
I prepare monthly marketing reports for 3 clients and always need to show channel performance as pie charts. This template replaced my tedious manual setup. The Template sheet's Category-Votes structure is dead simple -- I just paste in my traffic source names and their percentage contribution, select the range, Insert > Chart > Pie, and done. I use Example1 (Favorite Animal survey) to show new clients what the final output looks like before I plug in their real numbers. For $3.9, this has probably saved me 2 hours per month minimum.