 Quick view
Vendor: PlanoNest
Excel Xy Scatter Plot With Standard Deviation Excel Template | PlanoraNest TemplateRegular price $6.90
Sale price $3.90
4.7 / 5.0 (3) total reviews
Vendor: PlanoNest
Regular price $6.90
Sale price $3.90
Excel
Quick sign in at checkout — your templates are saved to your library forever.
Related picks
Explore other digital products that pair well with this template.
Quick viewVendor: PlanoNest
Excel Xy Scatter Plot With Standard Deviation Excel Template | PlanoraNest TemplateRegular price $6.90
Sale price $3.90
 Quick view
Vendor: PlanoNest
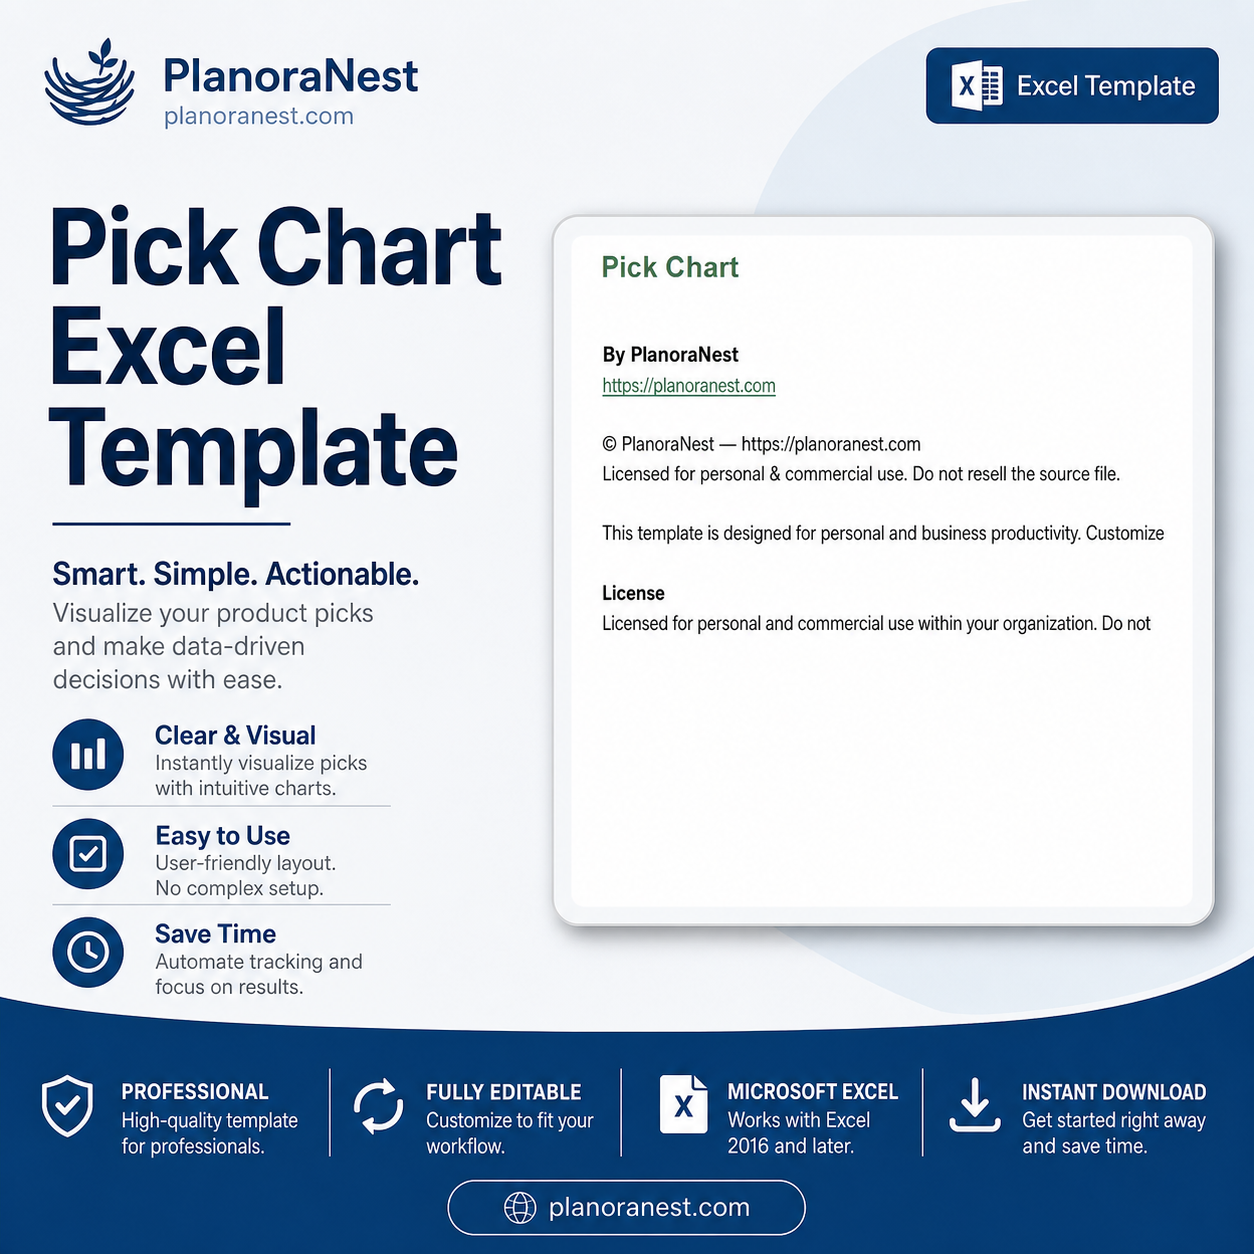
Pick Chart Excel Template | Pick Chart Template ExcelRegular price $6.90
Sale price $3.90
 Quick view
Vendor: PlanoNest
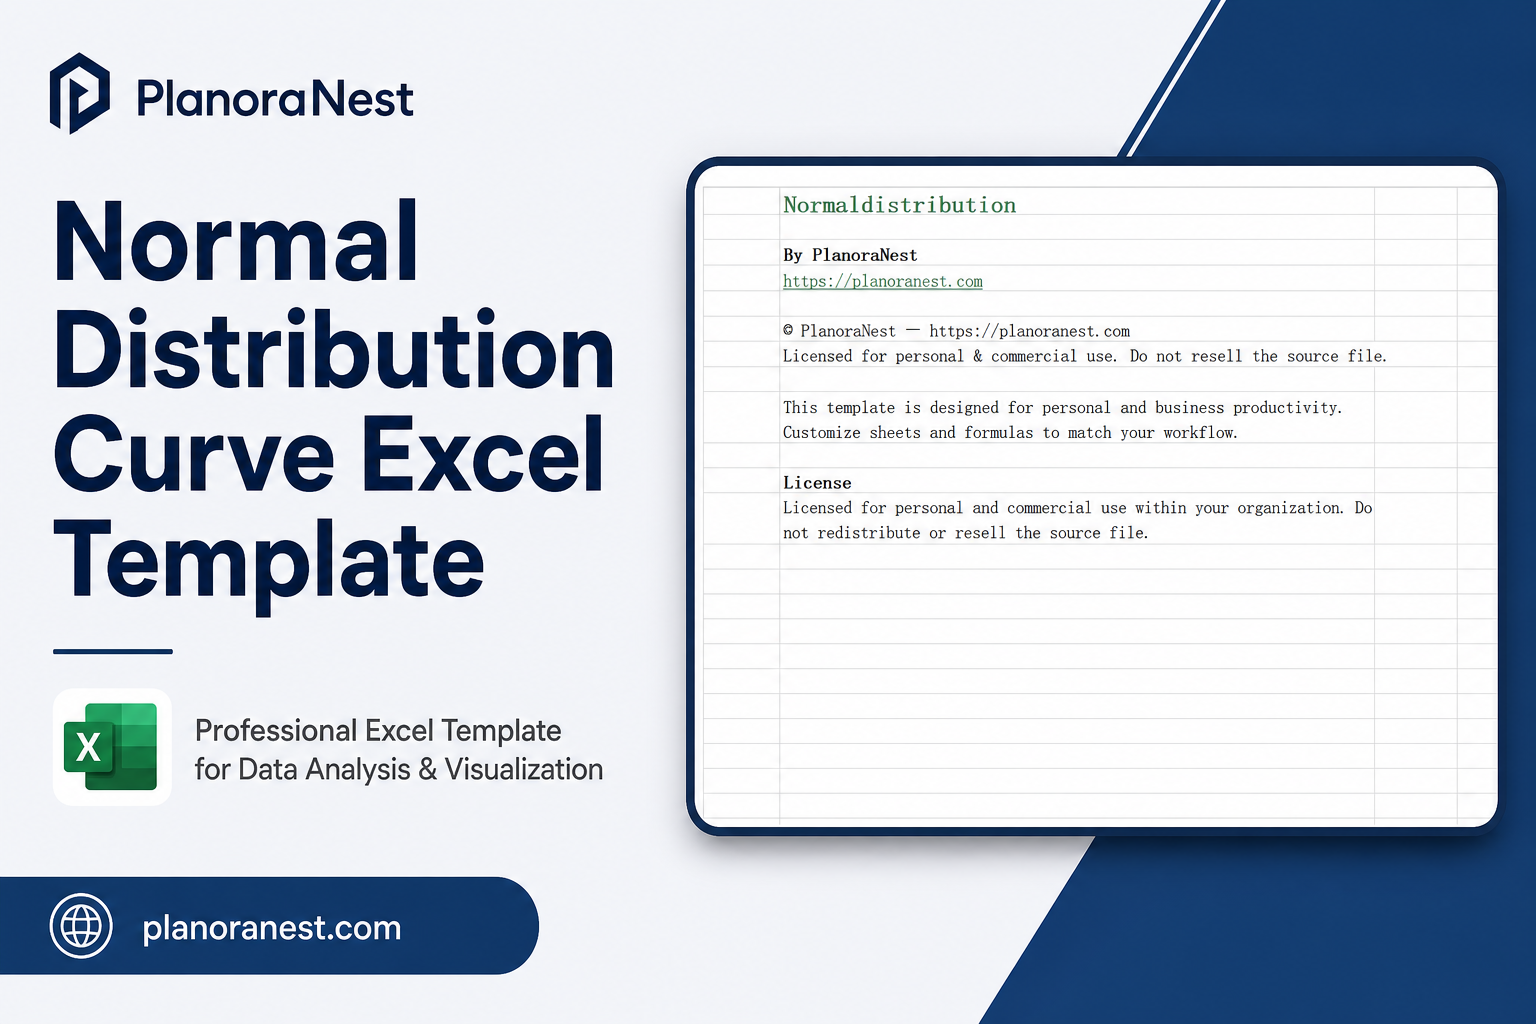
Normal Distribution Curve Excel Template | PlanoraNest TemplateRegular price $6.90
Sale price $3.90
 Quick view
Vendor: PlanoNest
Pie Chart Excel Template | PlanoraNest TemplateRegular price $6.90
Sale price $3.90
 Quick view
Vendor: PlanoNest
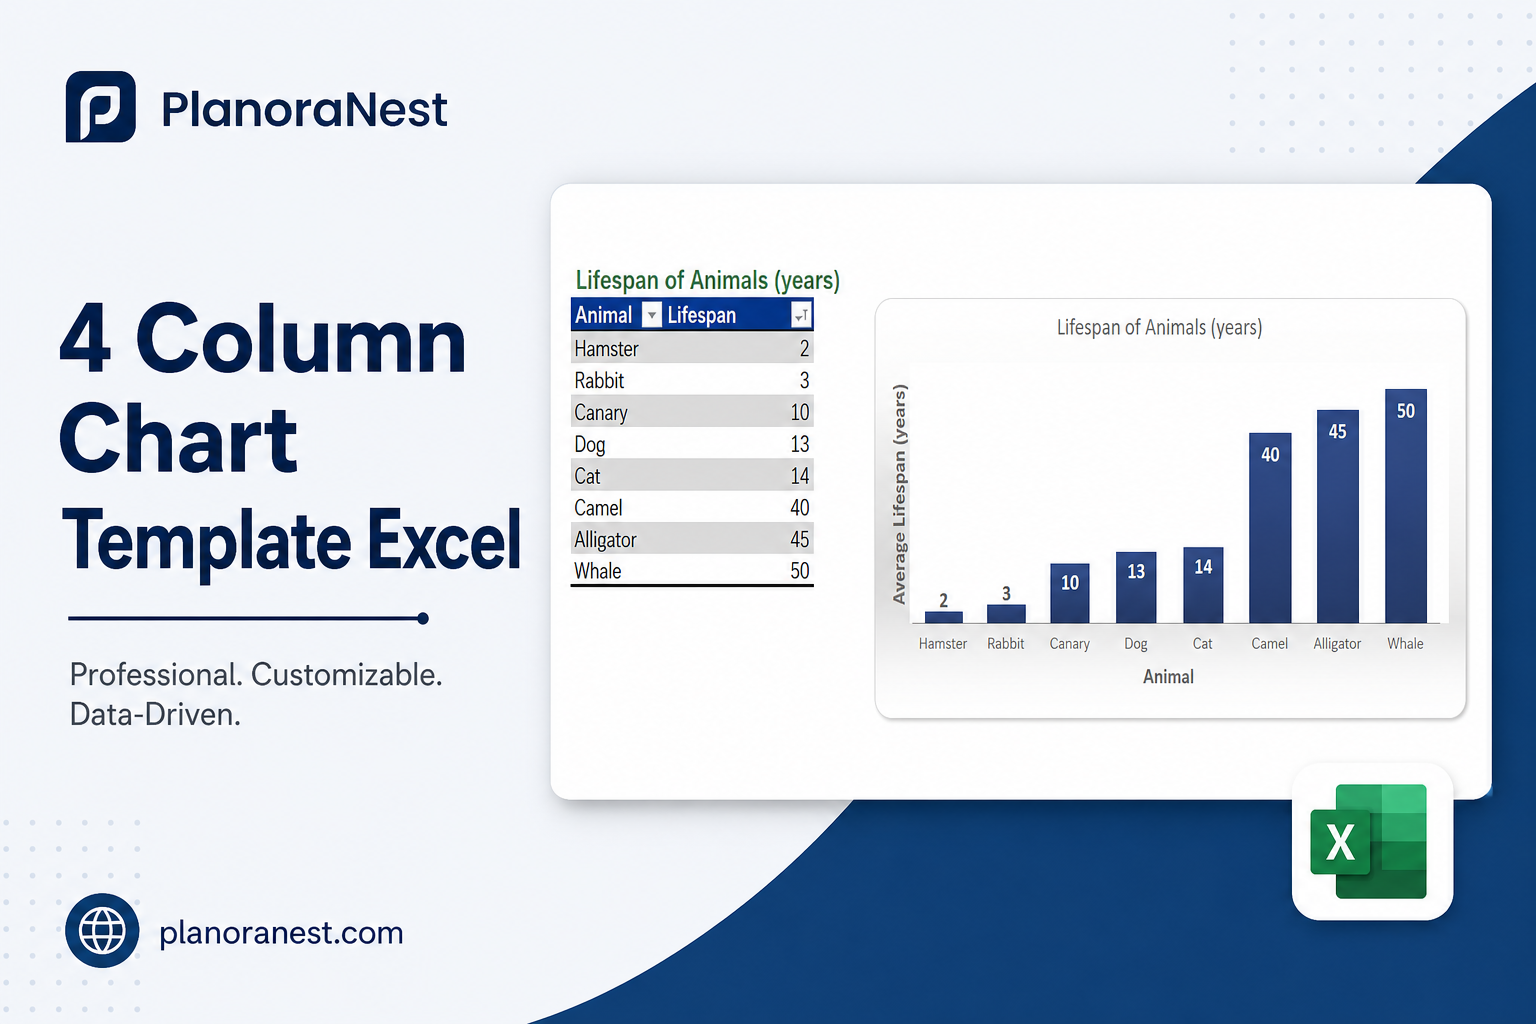
4 Column Chart Template Excel | PlanoraNest TemplateRegular price $6.90
Sale price $3.90
This download google spreadsheet line chart template from PlanoraNest gives you a ready-to-use Excel workbook for building time-series line charts with target lines. Whether you are tracking temperatures, daylight hours, sales trends, or project milestones, this template provides the structure, date series, and real-world examples you need.
Whether you search for add target line to excel chart or add a target line to excel chart, this file works in Excel, Google Sheets, WPS Office — one-time purchase at $3.9 (regularly $6.9), instant download, no subscription.
This line chart template is a strong fit for:
The file contains 5 sheets:
| Sheet | What it does |
|---|---|
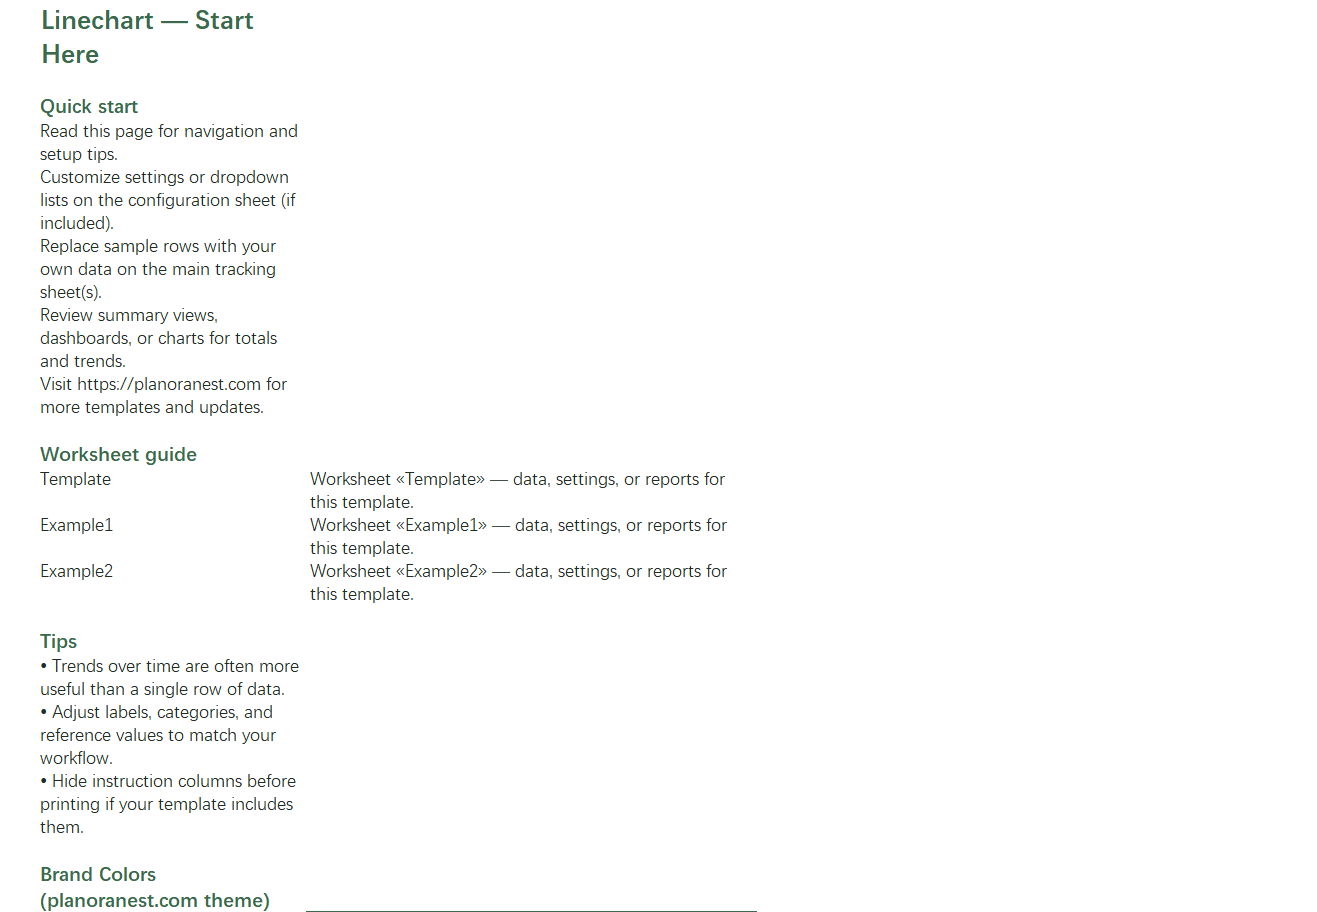
| Start Here | Quick-start guide with navigation tips and PlanoraNest brand color reference. |
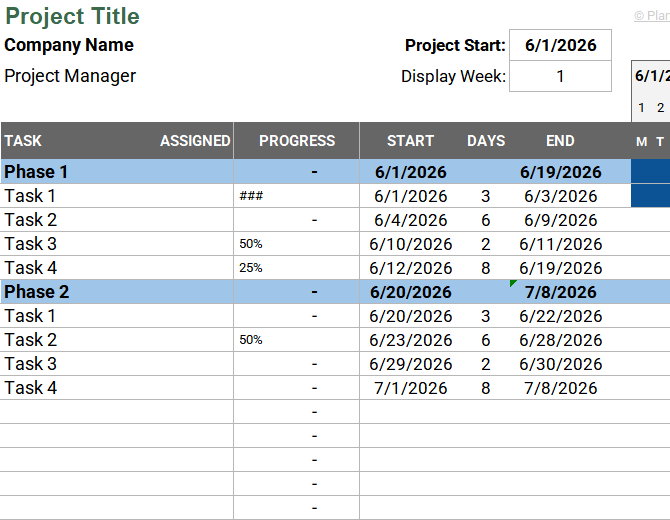
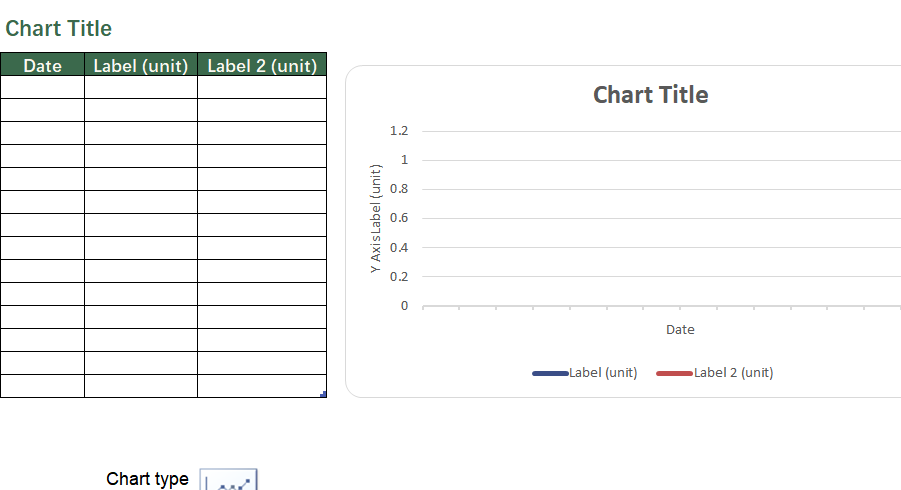
| Template | Blank line chart layout with Date, Label (unit), and Label 2 (unit) columns — enter your own time series and plot multi-line charts with up to 2 data series. |
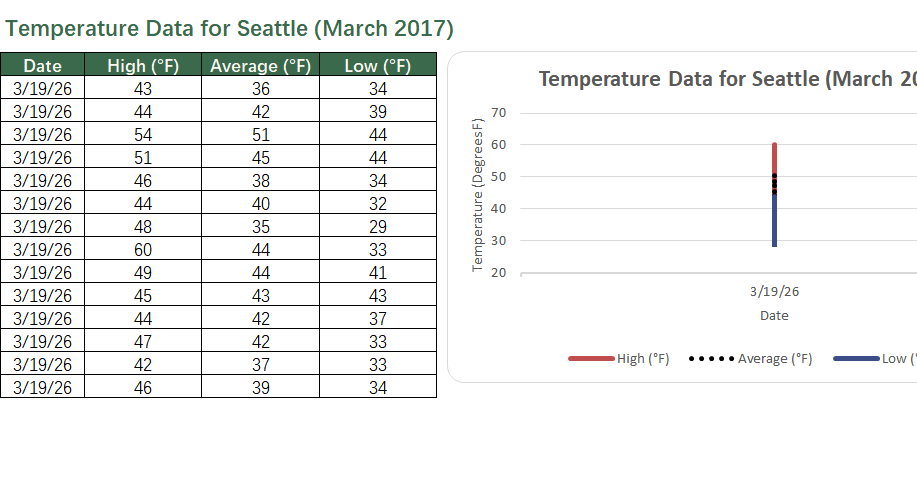
| Example1 | Temperature Data for Seattle (March 2017) — 14 daily records with High, Average, and Low temperature columns, perfect for a 3-line chart showing temperature bands over time. |
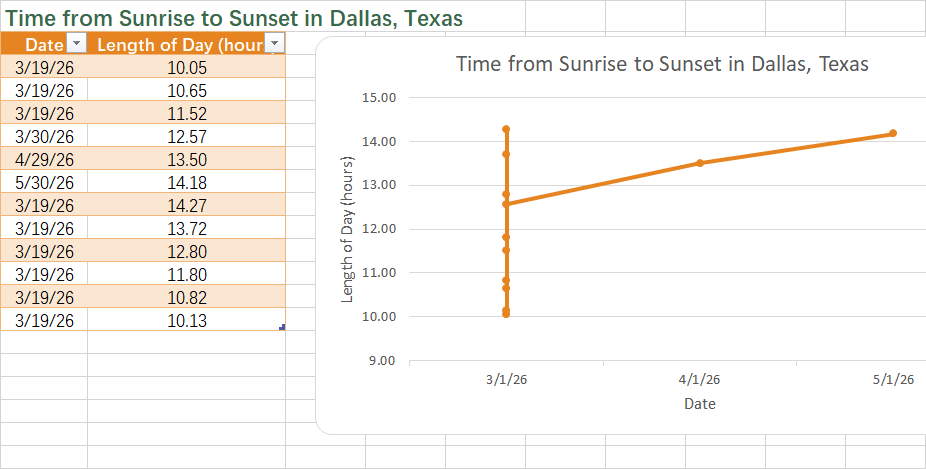
| Example2 | Time from Sunrise to Sunset in Dallas, Texas — 12 date records with Length of Day (hours), ideal for a single-line time-series with seasonal trend visualization. |
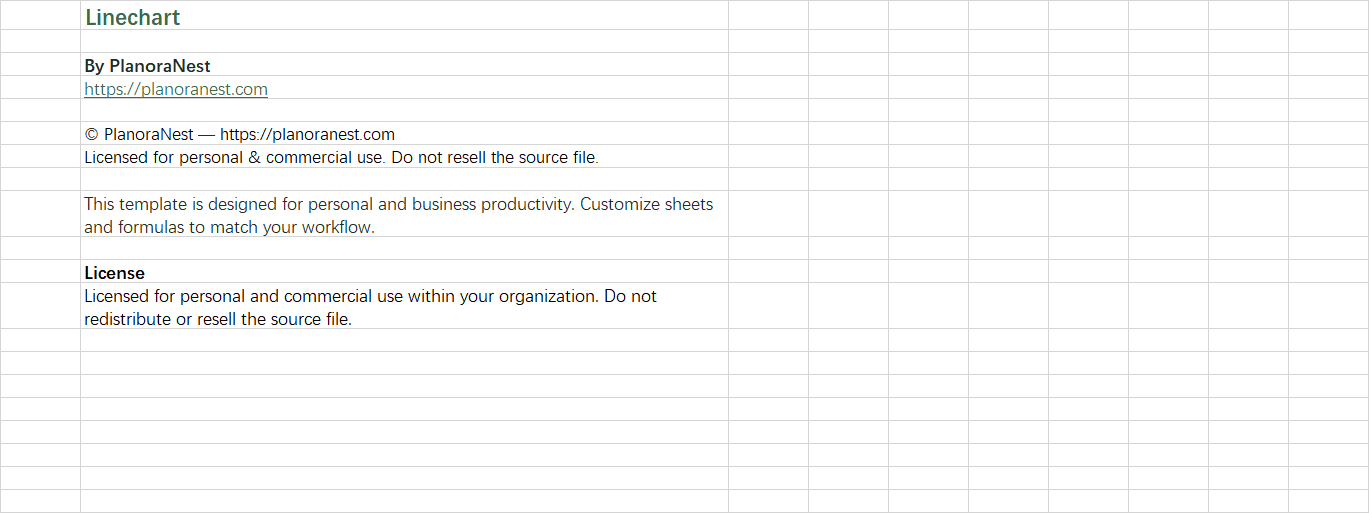
| About | Template attribution, license, and link to PlanoraNest. |
See how each sheet looks before you download — screenshots from the actual template.

Preview of Download Google Spreadsheet Line Chart Template | PlanoraNest Template
Preview of Download Google Spreadsheet Line Chart Template | PlanoraNest Template
Preview of Download Google Spreadsheet Line Chart Template | PlanoraNest Template
Preview of Download Google Spreadsheet Line Chart Template | PlanoraNest Template
Preview of Download Google Spreadsheet Line Chart Template | PlanoraNest Template
One-time purchase · $3.9 USD (regularly $6.9) · Instant download · No account required to use the file after purchase.
1. Purchase
Browse our shop and pick the templates that fit your needs — from business planners to productivity trackers.
2. Access
Since our products are digital, you'll receive immediate access after your purchase completes.
3. Use
Open your template in Google Sheets, Excel, or Notion and start using it right away with our included instructions.
David Okonkwo
Researcher
Verified purchaseSolid foundation for research data viz
As a grad student presenting time-series environmental data, this template saved me from the usual Excel chart formatting headaches. The 5 sheets are well-organized — Start Here guide, blank Template, two distinct examples, and About. I replicated the 3-line structure from Example1 (Seattle temps) for my own soil temperature data at three depths. One minor wish: a third example showing a target/goal line directly included in the template would make the add target line feature even clearer. Still, for $3.9, this is excellent value and I'll reuse it across multiple projects.
Chris Mueller
Independent contractor
Verified purchaseSimple and effective
I'm a freelance project manager and needed a line chart template for client progress reports. Downloaded this on a Tuesday, had my first client-facing chart ready that afternoon. The Template sheet is clean — just Date, Label, and Label 2 columns. No weird merged cells or broken formulas. I used Example2 (Dallas daylight hours) as a reference to understand single-line formatting. Works perfectly in Google Sheets too, which is what I use day-to-day.
Sarah Chen
Financial analyst
Verified purchaseExactly what I needed for monthly reporting
I track departmental expenses month-over-month and was tired of rebuilding line charts every reporting cycle. This template solved that. The Template sheet's Date-Label-Label2 structure mapped perfectly to my Actual vs Budget tracking. I added a third column for my target budget line, and within 15 minutes I had a clean 3-line chart. The Example1 Seattle temperature sheet was actually really helpful — seeing how they laid out High/Average/Low columns made the multi-line concept click for me immediately. Great value for $3.9.