 Quick view
Vendor: PlanoNest
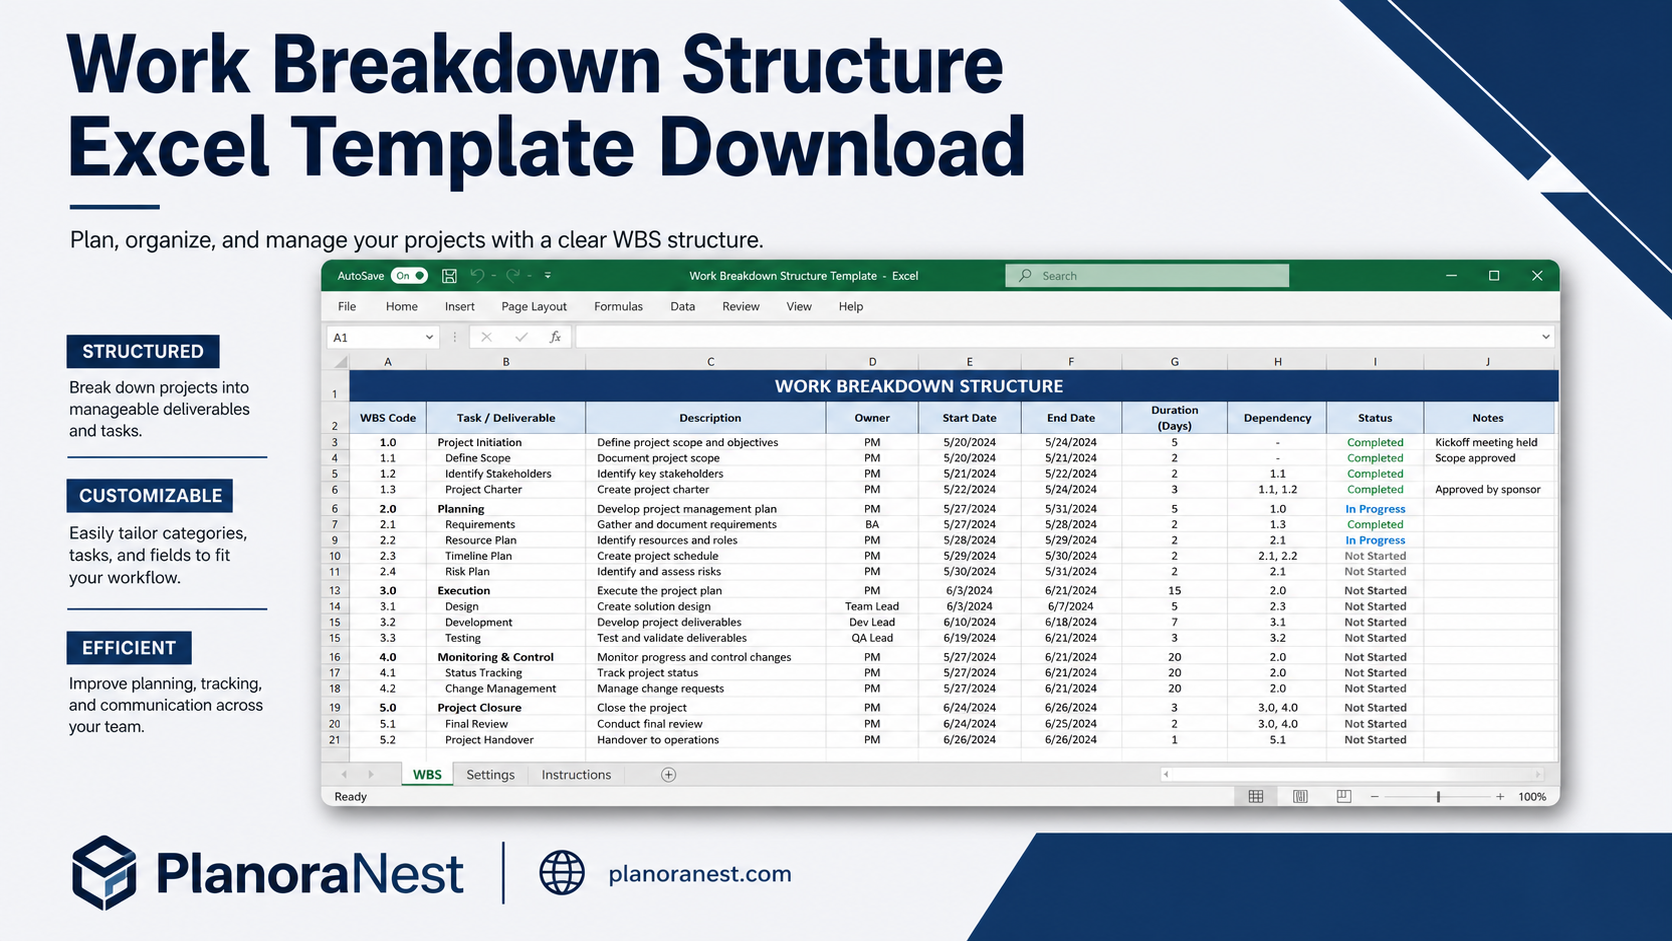
Work Breakdown Structure Spreadsheet Excel TemplateRegular price $6.90
Sale price $3.90
4.7 / 5.0 (3) total reviews

Vendor: PlanoNest
Regular price $6.90
Sale price $3.90
Excel
Quick sign in at checkout — your templates are saved to your library forever.
Related picks
Explore other digital products that pair well with this template.
Quick viewVendor: PlanoNest
Work Breakdown Structure Spreadsheet Excel TemplateRegular price $6.90
Sale price $3.90
Vendor: PlanoNest
Project Tracker Excel TemplateRegular price $6.90
Sale price $3.90
 Quick view
Vendor: PlanoNest
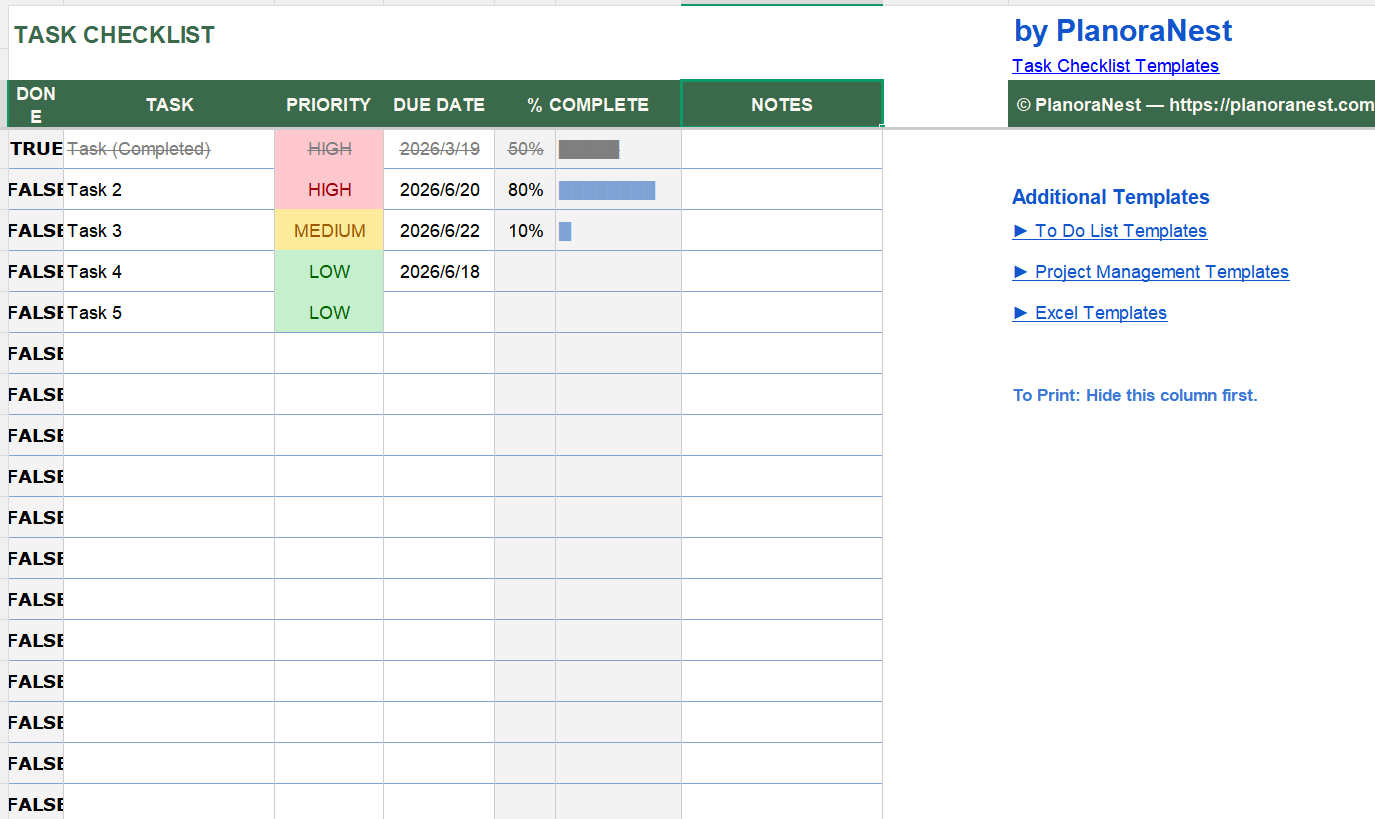
Daily Task Checklist Excel TemplateRegular price $6.90
Sale price $3.90
Vendor: PlanoNest
RACI Matrix Excel TemplateRegular price $6.90
Sale price $3.90
 Quick view
Vendor: PlanoNest
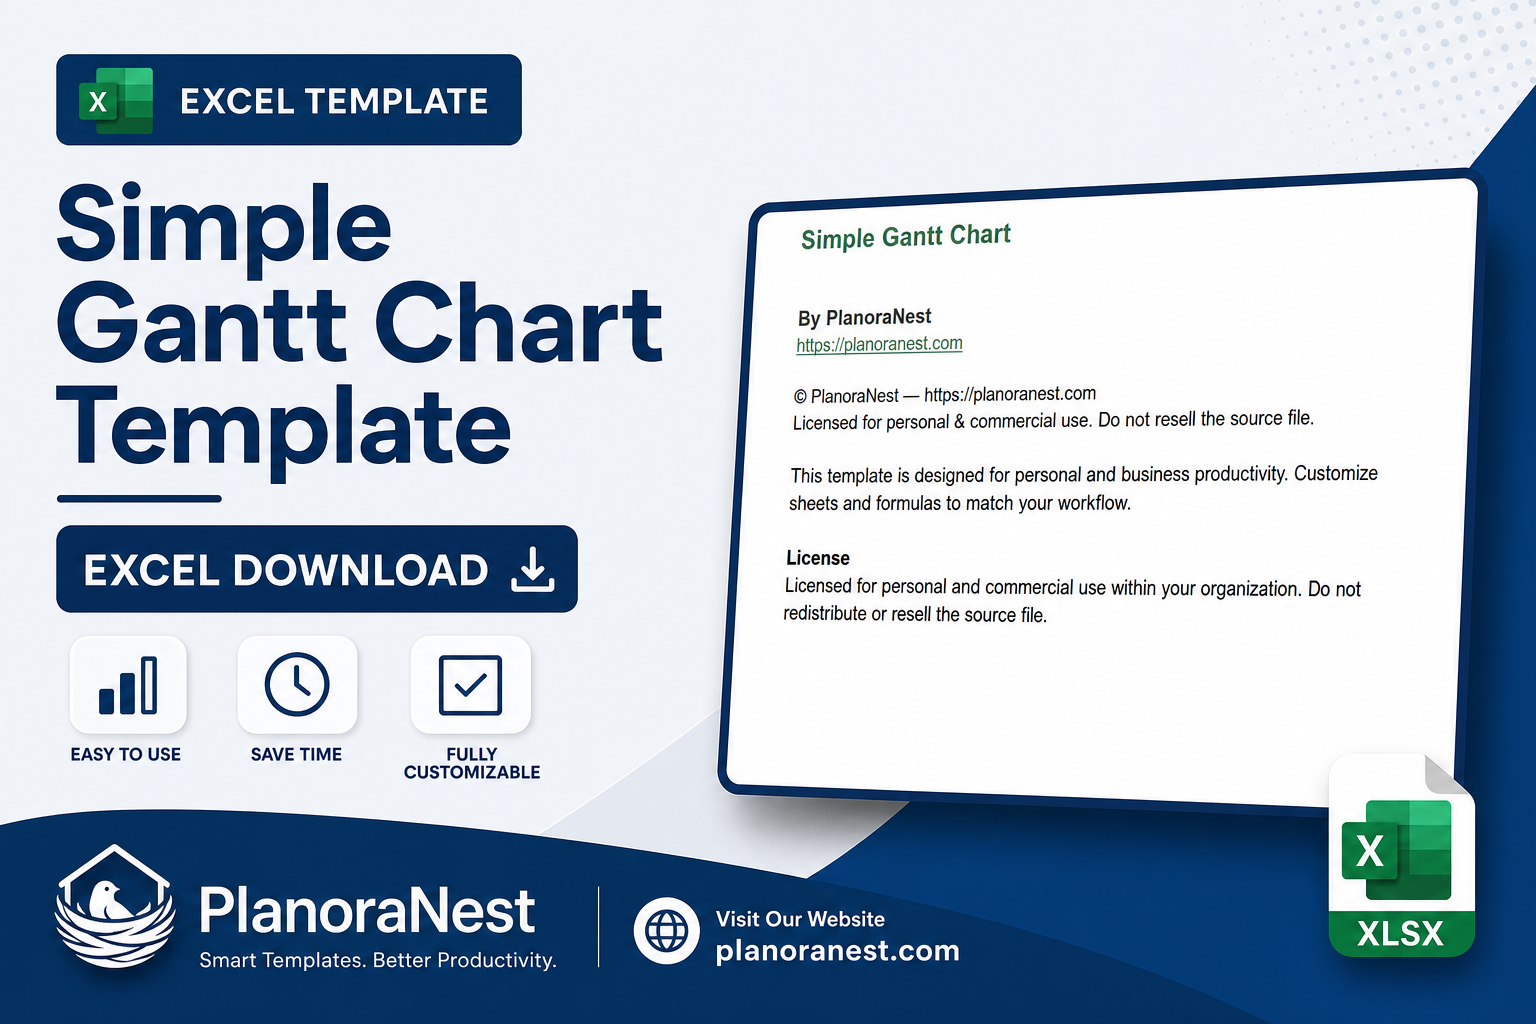
Simple Gantt Chart Template ExcelRegular price $6.90
Sale price $3.90
 Quick view
Vendor: PlanoNest
Project Timeline Template ExcelRegular price $6.90
Sale price $3.90
 Quick view
Vendor: PlanoNest
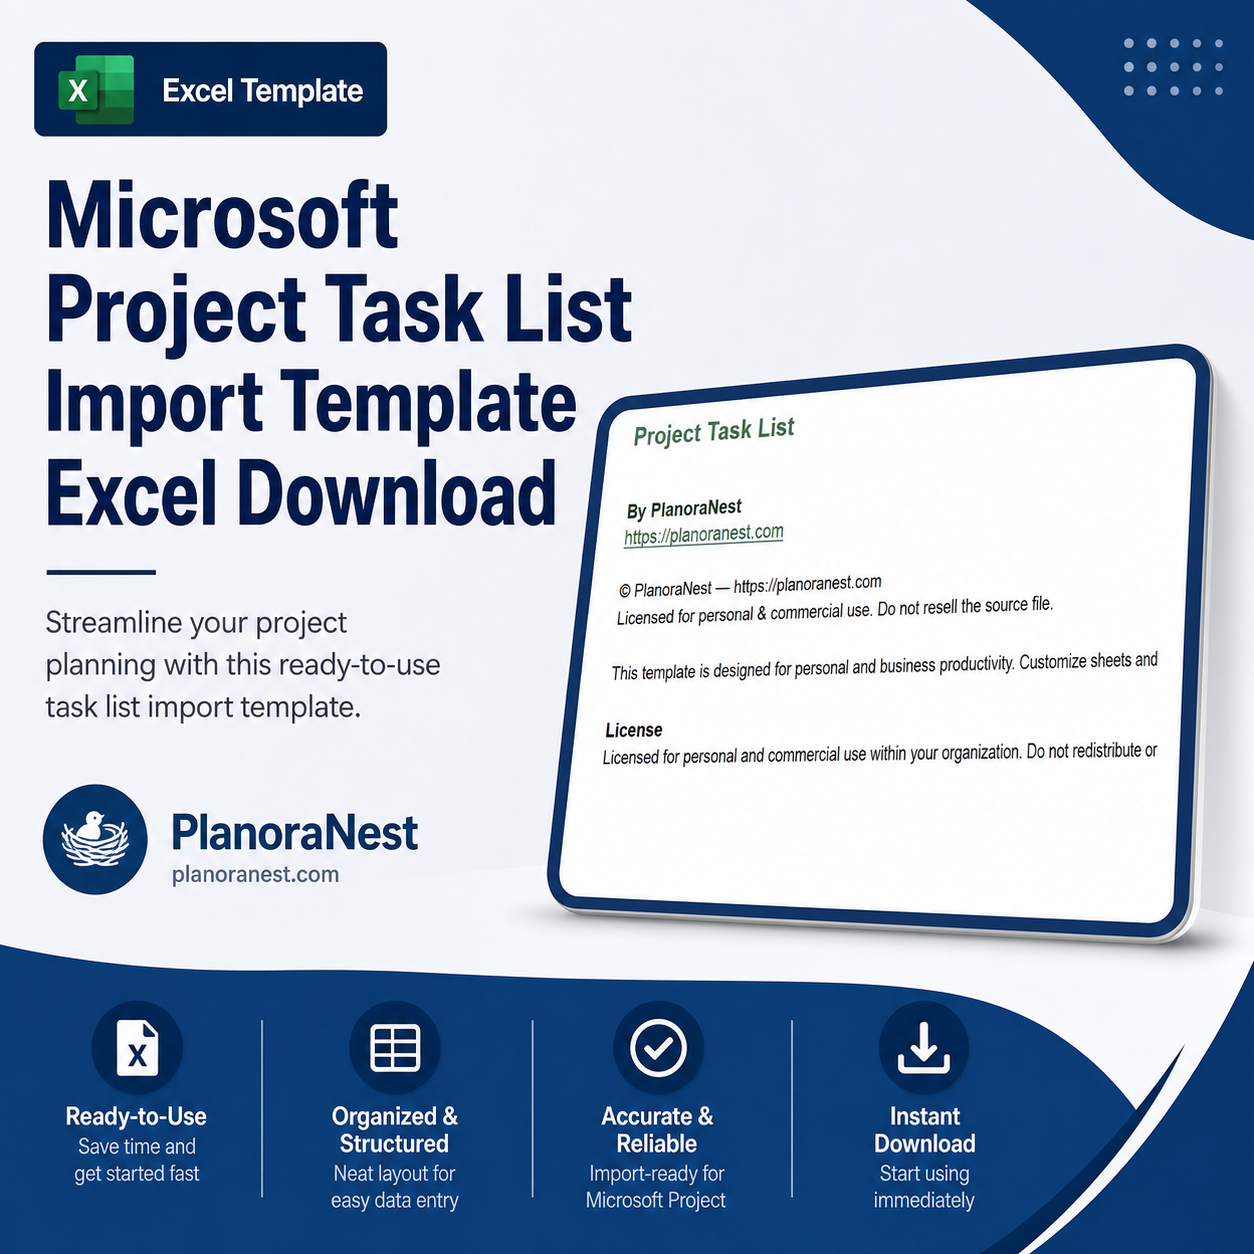
Microsoft Project Task List Import Template ExcelRegular price $6.90
Sale price $3.90
 Quick view
Vendor: PlanoNest
Gantt Chart Excel TemplateRegular price $6.90
Sale price $3.90
This Construction S Curve Excel template from PlanoraNest gives you a professional S-curve generator for tracking planned vs. actual progress on construction projects. Plot cumulative cost, man-hours, or percent complete over time with automatic curve calculation across 973 data rows.
Ideal for project controls engineers, quantity surveyors, and construction PMs who need earned value reporting without expensive specialized software. One-time purchase at $3.90, instant download, no subscription.
Every sheet in this Construction S Curve template is built for real project controls work:
| Sheet | What it does |
|---|---|
| Start Here | Step-by-step setup guide that walks you through entering project data, understanding the S-curve logic, and customizing the template. Start here to get oriented. |
| SCurve | The core worksheet with 13 columns across 973 rows. Enter your baseline/planned values and actual values over time. Columns include: Period (date/week), Planned Value, Actual Value, Cumulative Planned, Cumulative Actual, Variance, and percentage deviation. The S-curve chart auto-plots from this data — showing the classic banana curve of planned vs. actual cumulative progress. Includes built-in formulas for cumulative sums and variance calculations. |
| About | Template credits, version info, and terms of use. |
See how each sheet looks before you download — screenshots from the actual template.

Preview of Construction S Curve Excel Template
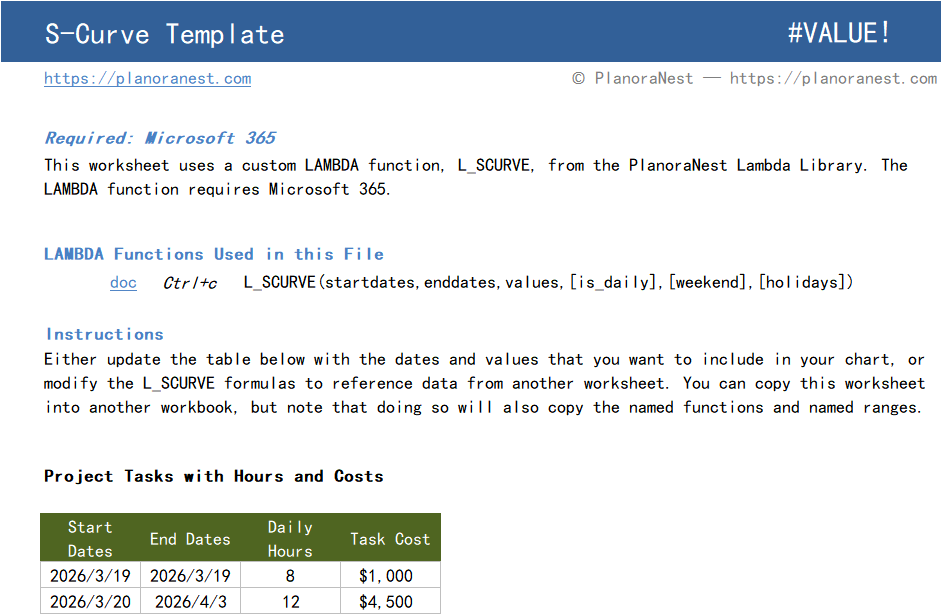
Preview of Construction S Curve Excel Template
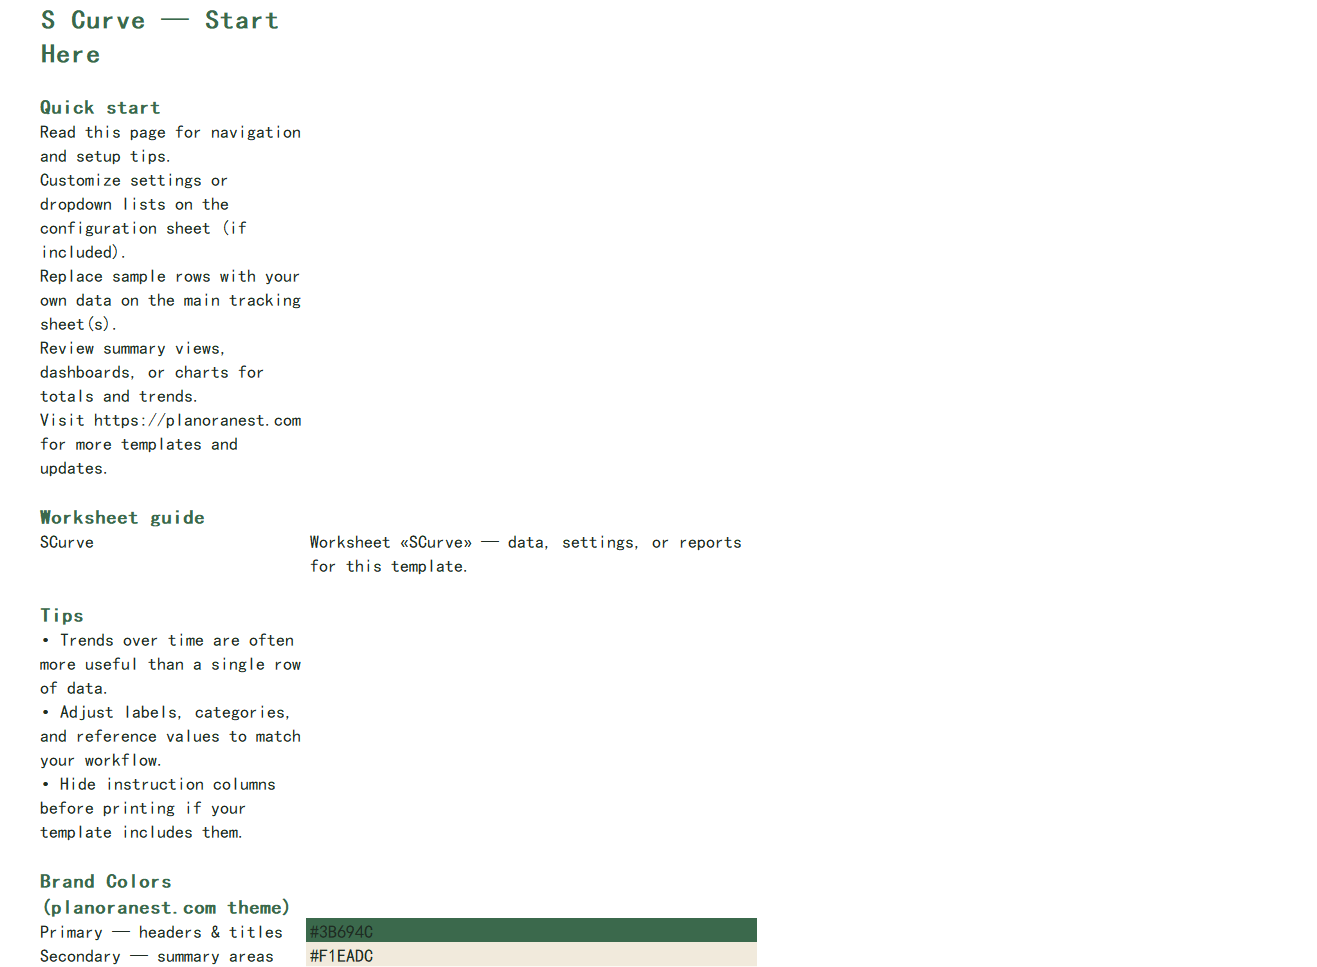
Preview of Construction S Curve Excel Template
One-time purchase · $3.90 USD · Instant download · No account required to use the file after purchase.
1. Purchase
Browse our shop and pick the templates that fit your needs — from business planners to productivity trackers.
2. Access
Since our products are digital, you'll receive immediate access after your purchase completes.
3. Use
Open your template in Google Sheets, Excel, or Notion and start using it right away with our included instructions.
Priya Nair
Quantity Surveyor
Verified purchasePerfect for interim payment applications
I prepare monthly valuations for a large residential project and the SCurve sheet is now central to my workflow. I track cumulative percent complete against the contract sum, and the curve makes it obvious to the client's QS where we stand. The best part — the Start Here sheet explains every column so clearly that I handed it to my junior QS and she was productive within the hour.
Tom Reyes
Construction Project Manager
Verified purchaseSaved hours on monthly progress reports
I used to build S-curves manually in Excel every month for our client report. This template cut that down to just updating the Actual column — the cumulative sums and chart refresh on their own. The Variance column caught a 2-week schedule slip that I might have missed otherwise. Only giving 4 stars because I wish it had a built-in histogram companion for resource loading.
Sarah Chen
Project Controls Engineer
Verified purchaseCleaner than our Primavera exports
We use Primavera P6 for scheduling but its S-curve reports are ugly and hard to format. This Excel template produces a much cleaner curve that I actually want to put in front of the client. I export our planned vs. actual from P6, paste into the SCurve sheet, and the cumulative columns and chart update instantly. The 973-row capacity covers our 18-month highway project at weekly granularity perfectly.